🌊 Find Temperature Breaks Today
Check the current SST conditions on our free animated SST chart — updated daily with NOAA satellite data. Pair it with the chlorophyll map and AI enhanced regional charts to find where breaks are concentrating bait and fish.
A temperature break is the single most important feature on an SST chart for offshore fishing. It’s where two water masses of different temperatures collide, creating a boundary that concentrates bait, builds structure in the open ocean, and draws in every predator from bluefin tuna to dorado. If you can read an SST chart well enough to find a defined temperature break, you’ve already eliminated 90% of the ocean from your search.
This guide covers how to identify temperature breaks from satellite data, what makes a break productive, and how to build a pre-trip plan around the edges you find. For how to actually fish a break once you’re on the water, see our fishing the edges guide.
What Is a Temperature Break?
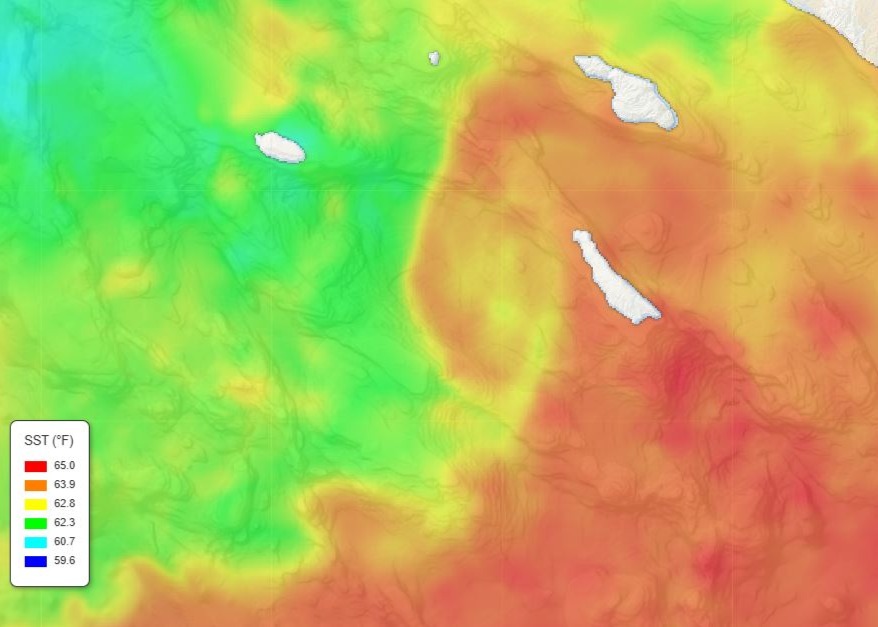
A temperature break is a sharp boundary where water temperature changes significantly over a short distance. On the SST chart, it shows up as a tight color transition — warm orange pressing against cool blue with a clean, defined line between them.
Not all temperature changes are breaks. A gradual warming from 62°F to 66°F over 20 miles is just a gradient — bait and fish spread out and nothing concentrates. A jump from 62°F to 66°F over a quarter mile is a break — bait stacks along the boundary, predators patrol it, and everything you want to catch is in a narrow, fishable zone.
The sharper the transition, the more productive the break. When you see a razor-sharp line on the SST chart, that’s where you want to be.
How to Find Breaks on the SST Chart
Step 1: Know Your Target Temperature
Before you look at the chart, know what water your target species wants. This tells you which breaks matter:
- Bluefin tuna: 60–72°F — look for breaks in this range, especially 62–68°F
- Yellowfin tuna: 68–78°F — the warm side of offshore breaks
- Dorado: 72–82°F — the warm, clean side where paddies collect
- Yellowtail: 62–70°F — breaks near islands and structure
- White seabass: 58–66°F — breaks near kelp during squid runs
- Wahoo: 72–82°F — the warmest, cleanest side of any break
Step 2: Scan for Sharp Transitions
Open the SST chart and zoom to your fishing area. Look for places where the color changes abruptly — not gradually. A productive break typically shows a 2–4°F change over a short distance. The tighter the color bands, the sharper the break.
Pay attention to where transitions intersect with underwater structure — banks, ridges, island drop-offs, and canyon edges. Structure plus a temperature break is a high-percentage combination.
Step 3: Cross-Reference with Chlorophyll
Switch to the chlorophyll map and check the same area. When a temperature break lines up with a chlorophyll edge — where green productive water meets clean blue water — you’ve found a “double edge.” These are the highest-probability fishing zones in the ocean because bait concentrates along both boundaries simultaneously. See our chlorophyll map guide for how to read these edges.
Step 4: Watch the Animation
Use the animated SST view to watch how the break has moved over the past week. A break that has been holding in the same area for 3–5 days is much more productive than one that just appeared. Persistent breaks give bait time to stack up and predators time to find it. A break that’s drifting rapidly may not have fish on it yet.
Step 5: Confirm with the Fleet
Check the fleet tracker to see if boats are already working the break. Multiple boats holding position along a line — rather than scattered randomly — is strong confirmation. If the satellite data and the fleet agree, you’ve found the bite.
What Makes a Break Productive
Not every temperature break holds fish. Here’s what separates a productive break from a dead one:
Sharpness. A 3°F change over a quarter mile concentrates fish. The same change over 10 miles doesn’t. Look for the tightest color transitions on the chart.
Persistence. A break that’s been in the same location for several days has had time to develop a food chain — plankton, bait, and predators. A brand-new break may take days to attract fish.
Proximity to structure. Breaks near banks, seamounts, island drop-offs, and canyon edges are more productive than breaks in open, featureless water. Structure amplifies the edge effect by creating upwelling and additional current features.
Bait presence. A sharp, persistent break near structure that also shows elevated chlorophyll (bait) is about as good as it gets. If you mark bait on your sounder when you arrive, you’re in the zone.
Current alignment. Breaks that form along current boundaries — where water masses moving in different directions collide — concentrate bait more effectively than thermal breaks alone. These often show up as elongated features on the SST chart.
Seasonal Break Patterns in SoCal
Spring (March–May): Defined breaks form between cooler coastal upwelling and warmer offshore water as the season warms. These breaks push closer to shore through spring and are where early-season bluefin and yellowtail first show up. Check the SST chart weekly to track the warm water pushing in. Have your bluefin reel spooled with fresh 50–65lb braid before the season starts.
Summer (June–August): Warm-water eddies spinning off the main current create circular temperature features with defined edges. These eddies can hold bluefin, yellowfin, and dorado for weeks. Look for circular warm features on the SST chart — the edges of these eddies are the fishing zones. Run a trolling spread along the edge while scanning for surface activity.
Fall (September–November): The sharpest breaks of the year form close to the islands as the warmest water meets cooling coastal water. This is often when the biggest bluefin of the year are caught — trophy fish that have been feeding all summer stage along these tightening edges. Surface iron and poppers are at their most effective when fish are stacked on a defined fall break.
Warm-water intrusions (any season): Tongues of warm water pushing inshore create narrow corridors with defined edges on both sides. Dorado and yellowfin ride these intrusions inshore, and the edges are where kelp paddies and debris collect. Run your dorado trolling spread — cedar plugs and feathers — along the warm side while searching for paddies.
Plan Your Trip
Find today’s temperature breaks before you leave the dock:
- SST Chart — Find the sharpest temperature transitions in your fishing area
- Chlorophyll Map — Identify where chlorophyll edges align with temperature breaks
- Marine Weather — Wind and swell conditions
- Fleet Tracker — See where boats are holding position along edges
- AI Fishing Predictions — Data-driven forecasts combining SST, chlorophyll, and historical data
- SD Fishing Season Calendar — What’s biting this month
Related Guides
- Fishing the Edges — How to Work a Temperature Break
- How to Read SST Charts
- How to Use Chlorophyll Maps
- How to Fish Kelp Paddies
- Swell, Wind & Fishing Conditions
- Best Water Temp for Bluefin Tuna
- Best Water Temp for Yellowfin Tuna
- Best Water Temp for Dorado
- Best Water Temp for Yellowtail
- Best Water Temp for White Seabass
- Best Water Temp for Wahoo
- Best Water Temp for Halibut
- Best Lures for Tuna
- Best Tuna Jigs
- Best Lures for Dorado
- Best Yellowtail Jigs & Irons
- Best Poppers for Tuna
- Surface Iron Fishing Guide
- Fly-Line Rig for Tuna
- Best Reel for Bluefin Tuna
- Best Reel for Yellowtail
- Best Rod & Reel Combos for SoCal
- Best Hooks by Species
- Braid vs Mono vs Fluorocarbon
- Best Fishing Line by Pound Test
- Best Fishing Knots
- Overnight Trip Packing List
- SD Fishing Season Calendar
Tight lines!