🌊 View Today’s Chlorophyll Map
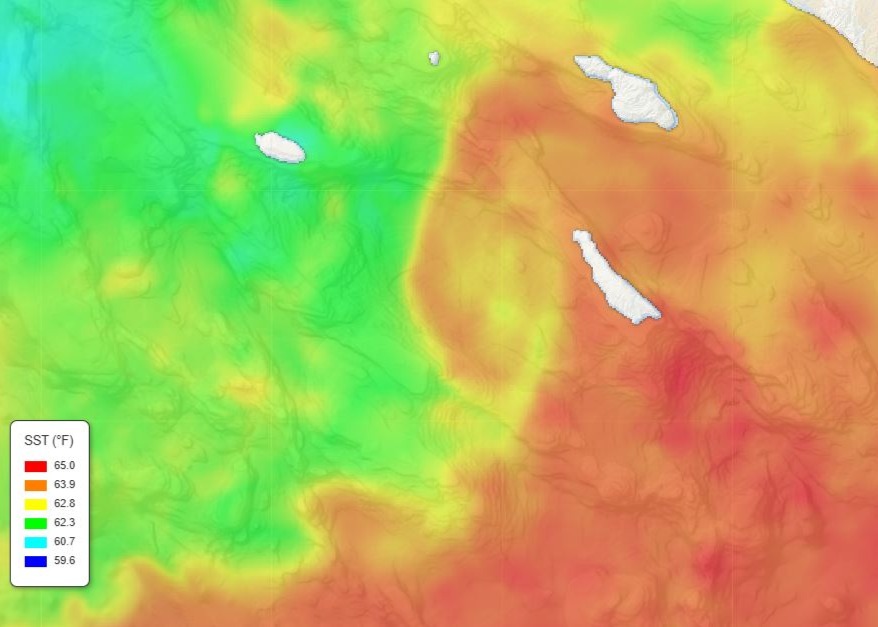
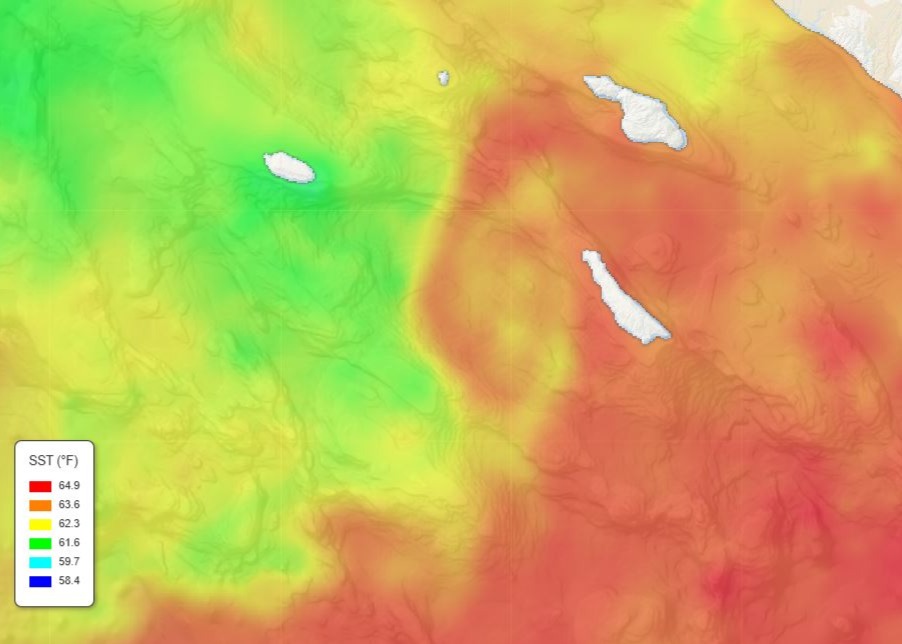
Check the current chlorophyll conditions for SoCal and Baja right now on our free animated chlorophyll map — updated daily with NOAA satellite data. Pair it with the Animated SST chart or AI Enhanced Regional SST charts to find where bait is stacking up along temperature breaks.
Most offshore anglers know about SST charts — sea surface temperature maps that show water temperature and temperature breaks. Fewer know about chlorophyll maps, and that’s a missed opportunity. Chlorophyll data tells you where the food chain starts, and ultimately, where gamefish are feeding.
If SST charts tell you where fish are comfortable, chlorophyll maps tell you where fish are eating. Used together, they’re the most powerful combination of satellite data available to recreational anglers.
What Chlorophyll Maps Show
Chlorophyll is the green pigment in phytoplankton — microscopic plants floating at the ocean surface. Satellites measure the color of the ocean from space. Green water has high chlorophyll (lots of phytoplankton). Blue water has low chlorophyll (clear, nutrient-poor water).
Why does this matter for fishing? Because the ocean food chain works like this:
Phytoplankton → Zooplankton → Baitfish → Gamefish
Areas with high chlorophyll are producing plankton, which attracts krill and small organisms, which attract anchovies, sardines, and squid, which attract tuna, yellowtail, dorado, and everything else you’re trying to catch. Chlorophyll maps show you the foundation of that food chain from 400 miles up.
How to Read a Chlorophyll Map
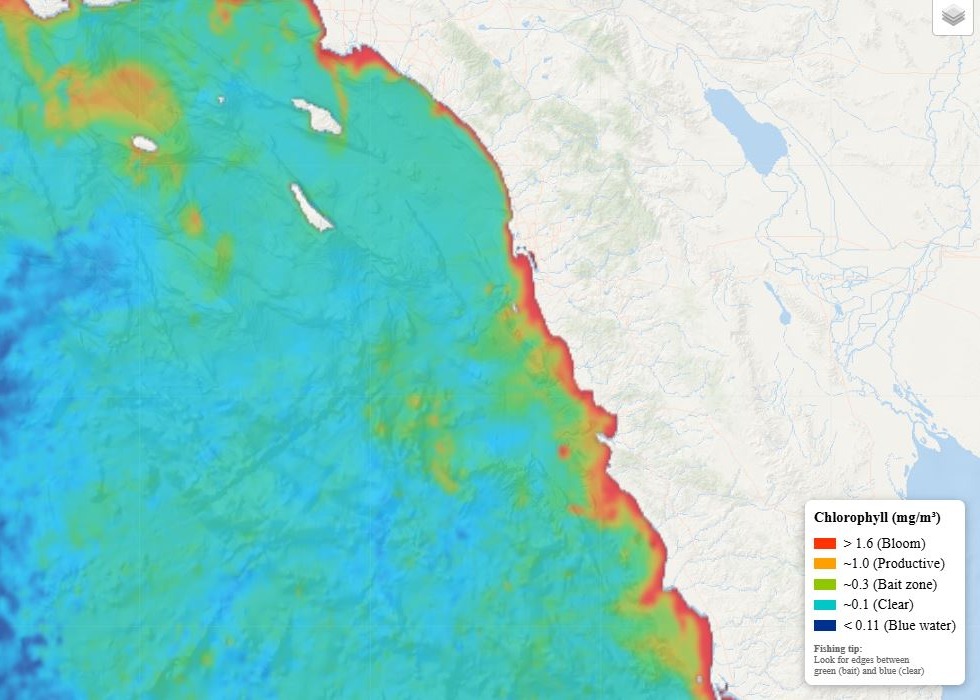
Chlorophyll maps on fishing-reports.ai use a color scale from blue to green:
- Dark blue — Very low chlorophyll. Clear, deep oceanic water. Low productivity. Fish density is usually low unless there’s other structure (temperature breaks, seamounts, debris).
- Light blue / cyan — Moderate chlorophyll. Transitional water. This zone often marks the boundary between productive coastal water and clean offshore water — a key area for fishing.
- Green / yellow-green — High chlorophyll. Productive, nutrient-rich water. Baitfish concentrations are likely. Nearshore and upwelling areas typically show this.
- Bright green / yellow — Very high chlorophyll. Extremely productive — often associated with active upwelling zones, river mouths, or nutrient plumes. Water may be too murky for pelagic fishing but holds bait.
The Money Zone: The Chlorophyll Edge
The single most valuable feature on a chlorophyll map is the chlorophyll edge — the boundary where green, productive water meets clean blue water. This is the fishing equivalent of the tree line at the edge of a field. Prey congregates along the edge, and predators patrol it.
Here’s why the edge is so productive:
- Bait stacks up — Small fish feed in the green productive water and get pushed against the boundary by currents. The edge acts as a concentration line.
- Predators prefer clean water — Tuna, dorado, and billfish generally prefer the cleaner blue side where they can see and hunt effectively. They work the edge, darting into the green side to feed.
- Current convergence — Chlorophyll edges often mark the boundary between two water masses moving at different speeds or directions. This convergence zone concentrates floating debris, kelp paddies, and bait.
On the chlorophyll map, look for a sharp transition from green to blue. The sharper and more defined the edge, the better. A gradual fade from green to blue over 50 miles is less useful than a crisp boundary over 5 miles.
Combining Chlorophyll with SST Charts
This is where the real power lies. Each data layer tells you something different, and together they paint a complete picture:
Step 1: Check the SST Chart
Open the SST chart and identify water in the right temperature range for your target species. (See our species temperature guides for bluefin tuna, yellowfin tuna, dorado, yellowtail, white seabass, and halibut.)
Step 2: Check the Chlorophyll Map
Switch to the chlorophyll layer and find the chlorophyll edge in the same area. Where is the green-to-blue transition relative to the water temperature you identified?
Step 3: Find the Overlap
The magic spot is where three things intersect:
- Water temperature in the right range for your target species
- A chlorophyll edge (green meets blue)
- A temperature break (warm meets cool)
When all three line up in the same area, you’ve found a high-probability fishing zone. This combination concentrates bait, provides the right thermal environment, and creates structure in the open ocean where gamefish feed.
Step 4: Check the Fleet
Confirm your analysis by looking at the fleet tracker. Are boats heading to or fishing in the area you identified? If the satellite data and the fleet agree, you’ve found the bite.
Chlorophyll Patterns for Each Species
Bluefin Tuna
Bluefin often work the chlorophyll edge from the blue side. They’re comfortable in moderate-to-clean water and will push into greener water to feed on bait schools. Look for the chlorophyll edge where it intersects with the 62–68°F temperature range. Bluefin tend to hold along the edge rather than ranging through open blue water. When you find them, surface iron, poppers, and trolling lures are how you capitalize — have your tuna setup rigged with 50–65lb braid and ready before you reach the edge. For live bait along the edge, circle hooks on a fly-line rig are deadly.
Yellowfin Tuna and Dorado
Both species prefer the clean blue side of the edge in water 72°F+. They’re more sight-oriented feeders that want visibility. The best dorado fishing is often a few miles on the blue side of the chlorophyll edge, especially when kelp paddies or debris are present. The edge concentrates the floating structure that dorado associate with. Run a trolling spread — cedar plugs and feathers — along the blue side of the edge while searching for paddies. When you find fish on a paddy, switch to casting: surface iron (Tady 45) and poppers draw explosive strikes from both species. A 20lb spinning setup handles dorado, but size up to a 40lb class if yellowfin are in the mix.
Yellowtail
Yellowtail are less picky about water clarity than tuna or dorado. They’ll feed comfortably in greener, more productive water — especially around kelp beds and structure where chlorophyll levels are naturally higher. For yellowtail, the chlorophyll data is most useful for identifying areas of strong upwelling (very high chlorophyll) that concentrate squid and baitfish near structure. When you find 62–70°F water with high chlorophyll near islands or kelp, bring your iron and jigs. A 30lb class setup with 40lb braid handles everything from casting iron at boils to yo-yoing structure. See our hooks guide for the right hook sizes.
White Seabass
White seabass thrive in the greener, more productive water that other pelagics avoid. They’re often caught in areas with moderate-to-high chlorophyll where squid are spawning. If the chlorophyll map shows a productive zone near islands or kelp beds in 59–65°F water during spring, that’s white seabass territory. Fish the kelp edges at dawn with a slider rig and live squid on a 4/0–6/0 circle hook. A 20–25lb class setup with 30lb braid and 25lb fluoro leader is the standard. See our hooks guide for specific models.
Halibut
For inshore species like halibut, chlorophyll maps help you identify where bait is stacking up along the coast. High chlorophyll nearshore — especially near sandy flats and bay mouths — means baitfish concentrations that pull halibut into shallow water. This is when swimbaits and Carolina rigs on the sandy flats produce best. From shore, a 4000–5000 spinning reel on a 9–10 foot surf rod with 20lb braid covers it. See our halibut surf fishing guide for beach-specific techniques.
Common Mistakes When Reading Chlorophyll Maps
Fishing in the green — New users see high chlorophyll and think “bait = fish.” But if you’re targeting tuna or dorado, the green water itself is often too murky. Fish the edge, not the middle of the green zone.
Ignoring the time lag — Chlorophyll responds to nutrients with a delay. An upwelling event might take 3–7 days to produce a visible chlorophyll bloom. And baitfish may take another few days to aggregate. A brand-new upwelling plume might not hold fish yet, but one that’s been established for a week is worth fishing.
Cloud cover gaps — Like SST charts, chlorophyll maps are satellite-based and blocked by clouds. If the latest image is patchy, check the previous day’s image or use the multi-day composite view on the charts page.
Trusting it alone — Chlorophyll maps are one piece of the puzzle. Always combine with SST data, fleet intel, swell conditions, and fishing reports. No single data source tells the whole story.
Seasonal Chlorophyll Patterns in SoCal
The chlorophyll picture off Southern California changes throughout the year:
Winter–Spring (Jan–Apr): Strong coastal upwelling produces high chlorophyll nearshore. The green water extends well offshore, and the chlorophyll edge may be 30–50+ miles out. This is when the ocean is most productive overall — good for bait production that fuels the spring and summer fisheries. Prime time for white seabass in the green water and early-season yellowtail near structure.
Late Spring–Summer (May–Aug): Upwelling relaxes, and the chlorophyll edge moves closer to shore. Offshore water becomes cleaner and bluer. Clear temperature and chlorophyll edges form between the coastal upwelling zone and the clean offshore water — these are prime fishing boundaries for bluefin, yellowfin, and dorado as warm water pushes in.
Fall (Sep–Nov): Chlorophyll levels decrease as upwelling weakens and surface water warms. The green-to-blue transition can be quite sharp and close to shore. Look for remaining productive pockets around the islands and banks. Late-season dorado and yellowfin concentrate along these tightening edges.
Plan Your Trip
Ready to add chlorophyll data to your pre-trip planning? Start here:
- Chlorophyll Map — Daily satellite chlorophyll imagery for SoCal and Baja
- SST Chart — Layer temperature data with chlorophyll for the complete picture
- Marine Weather — Wind, swell, and offshore conditions
- Fleet Tracker — Confirm your analysis by seeing where the fleet is fishing
- AI Fishing Predictions — Our model factors in chlorophyll along with SST, swell, and historical data
- SD Fishing Season Calendar — What’s biting this month
Related Guides
- How to Read SST Charts
- How to Find Temperature Breaks
- How to Fish Kelp Paddies
- Swell, Wind & Fishing Conditions
- Best Water Temp for Bluefin Tuna
- Best Water Temp for Yellowfin Tuna
- Best Water Temp for Dorado
- Best Water Temp for Yellowtail
- Best Water Temp for White Seabass
- Best Water Temp for Halibut
- Best Lures for Tuna
- Best Tuna Jigs
- Best Lures for Dorado
- Best Yellowtail Jigs & Irons
- Best Poppers for Tuna
- Surface Iron Fishing Guide
- Best Swimbaits for Halibut
- Best Reel for Bluefin Tuna
- Best Reel for Yellowtail
- Best Rod & Reel Combos for SoCal
- Carolina Rig Setup
- Slider Rig for Live Bait
- Fly-Line Rig for Tuna
- Best Hooks by Species
- Circle Hooks vs J Hooks
- Braid vs Mono vs Fluorocarbon
- Best Fishing Line by Pound Test
- Best Fishing Knots
- Best Surf Fishing Reels
- Best Surf Casting Rods
- Halibut Surf Fishing in SoCal
- SD Fishing Season Calendar
Tight lines!