Your fishing line is the only connection between you and the fish. Choose the wrong one and you’ll lose fish, miss bites, and waste money. Choose the right one — and match it to the right situation — and your catch rate goes up immediately.
Here’s the short answer most SoCal anglers land on: braided mainline + fluorocarbon leader. It’s the standard setup for 90% of saltwater applications from surf to tuna. But understanding why — and when to break from this standard — will make you a better angler. For specific line weight recommendations by species, see our best fishing line by pound test guide.
Quick Comparison
| Property | Braided | Monofilament | Fluorocarbon |
|---|---|---|---|
| Diameter | Thinnest (per lb test) | Thickest | Medium |
| Stretch | Near zero | High (25–30%) | Low (5–10%) |
| Visibility | Visible (colored) | Low (clear) | Nearly invisible underwater |
| Abrasion resistance | Low | Good | Excellent |
| Sensitivity | Excellent | Low | Good |
| Sinks or floats | Floats | Slow sink | Sinks |
| UV resistance | Excellent | Poor (degrades) | Excellent |
| Cost | High upfront, lasts long | Cheap | Most expensive per yard |
| Knot strength | Needs specific knots | Easy to knot | Needs wet knots, can be stiff |
Braided Line: Your Mainline
Braid is the standard mainline for SoCal saltwater fishing. Here’s why:
Thinner diameter = more capacity. 30lb braid has the same diameter as 8lb mono. This means you can fit 300+ yards of heavy line on a reel that would only hold 150 yards of equivalent mono. When a yellowtail or tuna takes a 200-yard run, that extra capacity is the difference between landing the fish and getting spooled.
Zero stretch = instant sensitivity. Braid doesn’t stretch, so every movement of your lure and every bite transmits directly to your rod tip. You feel structure, detect subtle bites (critical for halibut on swimbaits), and get faster hooksets.
Longevity. Braid doesn’t degrade from UV exposure or develop “memory” (coils from being spooled). A quality braid can last a year or more before needing replacement, while mono should be replaced every few months.
When NOT to use braid as mainline: Braid is visible in the water and has zero abrasion resistance against rocks and structure. This is why you always use a leader — never tie braid directly to your hook or lure (except for some topwater applications like surface iron where visibility doesn’t matter and maximum casting distance is the priority).
Fluorocarbon: Your Leader Material
Fluorocarbon is the standard leader material for saltwater fishing. It bridges the gap between braid’s sensitivity and the fish’s wariness:
Nearly invisible underwater. Fluorocarbon has a refractive index close to water, making it almost invisible to fish. In clear SoCal water, this is a major advantage — line-shy fish like halibut and white seabass can see mono but struggle to detect fluoro.
Abrasion resistant. Fluorocarbon holds up against rocks, kelp, and sharp gill plates better than braid or mono. When your leader is rubbing against a yellowtail’s body during the fight, fluoro survives. Braid would be cut in seconds.
Sinks. Fluorocarbon sinks naturally, which keeps your bait or lure down in the water column. This is important for Carolina rigs, fly-line rigs, and any bottom-fishing application.
Low stretch. Not quite zero like braid, but much less than mono. You maintain good sensitivity through the leader while getting the shock absorption that braid can’t provide.
Tips for fluorocarbon: Always wet your knots before cinching — dry fluoro generates heat that weakens the line. Use a Palomar knot for terminal connections and an FG knot for braid-to-leader connections. Fluoro is stiffer than mono, so leave a slightly longer tag end to prevent slippage.
Monofilament: Still Has Its Place
Mono gets overlooked in the braid era, but it still has legitimate applications:
Trolling. Mono’s stretch acts as a shock absorber when a fish strikes a trolled lure at speed. This prevents pulled hooks and broken leaders. Many experienced trollers run mono mainline specifically for this cushion effect — it’s especially valuable for dorado and tuna trolling spreads with cedar plugs and feathers.
Live bait soaking. When fishing live bait for tuna or white seabass, mono’s stretch gives the fish time to eat the bait without feeling hard resistance. This is why some captains recommend mono topshots on tuna rigs.
Budget option. Mono is dramatically cheaper than braid or fluoro. If you’re filling multiple reels and budget is a concern, mono mainline with a short fluoro leader still catches plenty of fish. It won’t perform as well, but it works.
Surf fishing (in certain conditions). Some surf anglers prefer mono because it’s less likely to catch wind and create tangles on long casts. The stretch can also help absorb wave surge when fighting fish in the surf.
Leader material (budget). Mono leaders work fine in murky water or when targeting less line-shy species. A 20lb mono leader is significantly cheaper than 20lb fluoro and will get the job done when conditions aren’t finesse-demanding.
The SoCal Standard: Braid + Fluoro Leader
Here’s how to set up the standard rig for different SoCal scenarios. For specific line weight and brand recommendations, see our fishing line by pound test guide.
Surf fishing: 20lb braid mainline → 15–20lb fluorocarbon leader (3–4 feet) → Palomar knot to hook. Connect braid to leader with an FG knot or double uni. Pair with a 4000–5000 spinning reel on a 9–10 foot rod.
Party boat (yellowtail/calico): 30lb braid → 25–30lb fluoro leader (4–6 feet) → Palomar knot to jig or hook. Pair with a 20lb conventional reel or 30lb reel on a 7-foot rod. See our yellowtail reel guide for specific models.
Tuna (bluefin/yellowfin): 50–65lb braid → 40–60lb fluoro leader (6–15 feet depending on water clarity) → circle hook or jig. The leader length matters more for tuna — clear water = longer leader. Pair with a 40lb+ conventional reel on an 8-foot rod. See our bluefin reel guide for complete recommendations.
Halibut (boat or shore): 15–20lb braid → 12–20lb fluoro leader (2–3 feet) → Carolina rig or swimbait. Light leader is important — halibut can be line-shy in clear water.
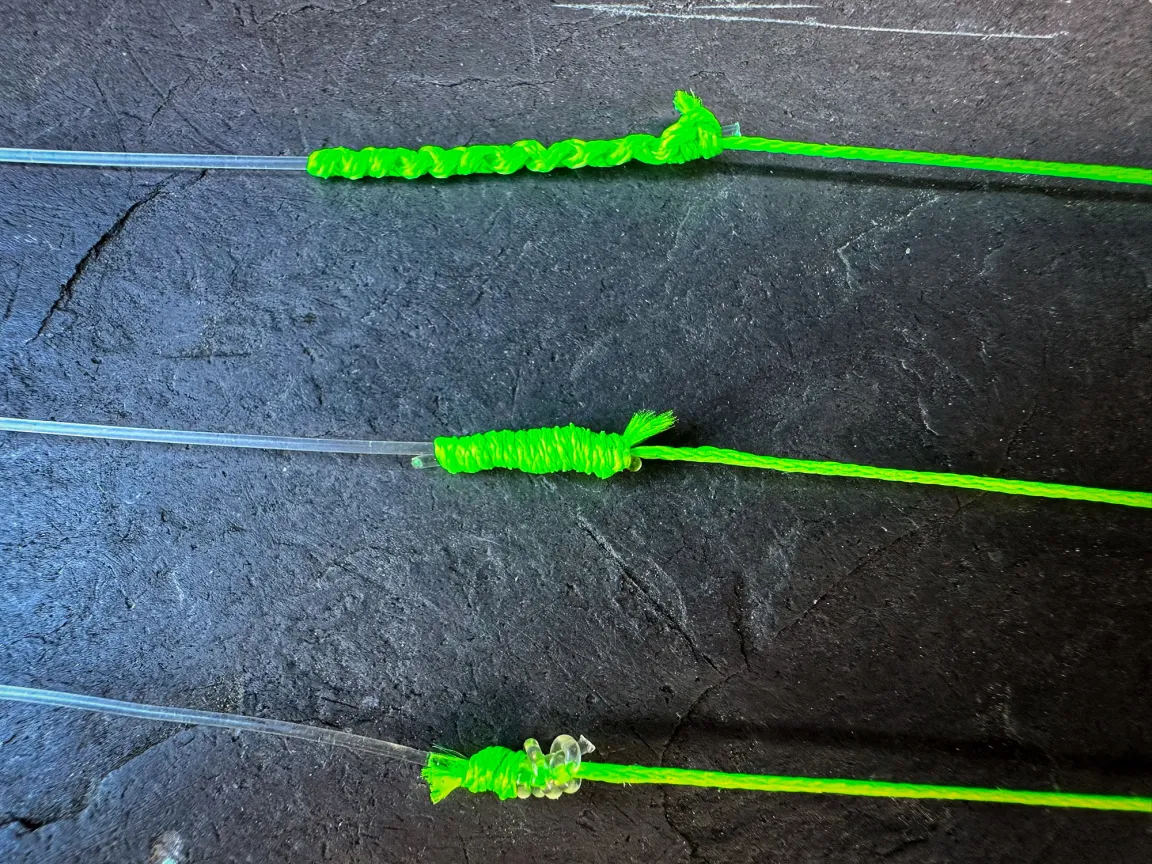
Braid-to-Leader Knots
The connection between your braid mainline and fluorocarbon leader is the weakest point in your system. Use the right knot:
FG Knot: The strongest braid-to-leader connection. Retains nearly 100% of line strength and creates a slim, low-profile knot that slides through guides easily. It takes practice to tie, but it’s worth learning for any application over 20lb. See our complete knot guide.
Double Uni Knot: Easier to tie than the FG and still retains 85–90% strength. Good for lighter applications (under 30lb) or when you need to retie quickly on the water.
Alberto Knot: A modified version of the Uni that works well for connecting braid to heavier fluoro (30lb+). Good compromise between strength and ease of tying.
For terminal connections (line to hook/lure), the Palomar knot retains 90–95% strength on all three line types and should be your go-to. See our hooks by species guide for the right hook to tie it to.
Choosing Pound Test
| Target Species | Braid Mainline | Fluoro Leader |
|---|---|---|
| Surf perch, croaker | 10–15lb | 8–12lb |
| Halibut | 15–20lb | 12–20lb |
| Calico bass | 20–30lb | 15–25lb |
| Yellowtail | 30–40lb | 25–40lb |
| White seabass | 30–40lb | 25–30lb |
| Dorado | 30–40lb | 25–30lb |
| Bluefin tuna | 50–80lb | 40–60lb |
| Yellowfin tuna | 40–65lb | 30–50lb |
For a deeper dive on matching line weight to species — including specific braid and fluorocarbon brand recommendations — see our best fishing line by pound test guide.
Common Mistakes
Not using a leader. Running straight braid to your hook is the number one mistake beginners make. Fish can see braid, and it has zero abrasion resistance. Always use a fluorocarbon (or at minimum mono) leader.
Leader too short. A 12-inch leader defeats the purpose. Use at least 3 feet for inshore and 6+ feet for offshore in clear water. The fish need enough distance from the visible braid to not be spooked.
Not replacing mono. Monofilament degrades from UV exposure and develops memory. If you’re using mono mainline, re-spool every 2–3 months or after heavy use. Braid and fluoro last much longer.
Dry knots on fluoro. Cinching a fluorocarbon knot without wetting it first can weaken the line by up to 20%. Always wet your knots — saliva or water, every single time.
Using fluoro as mainline. Fluoro is expensive and has more memory than braid. Using it as mainline fills your reel with costly line that doesn’t cast as well. Use it for leaders and use braid or mono as mainline.
Plan Your Trip
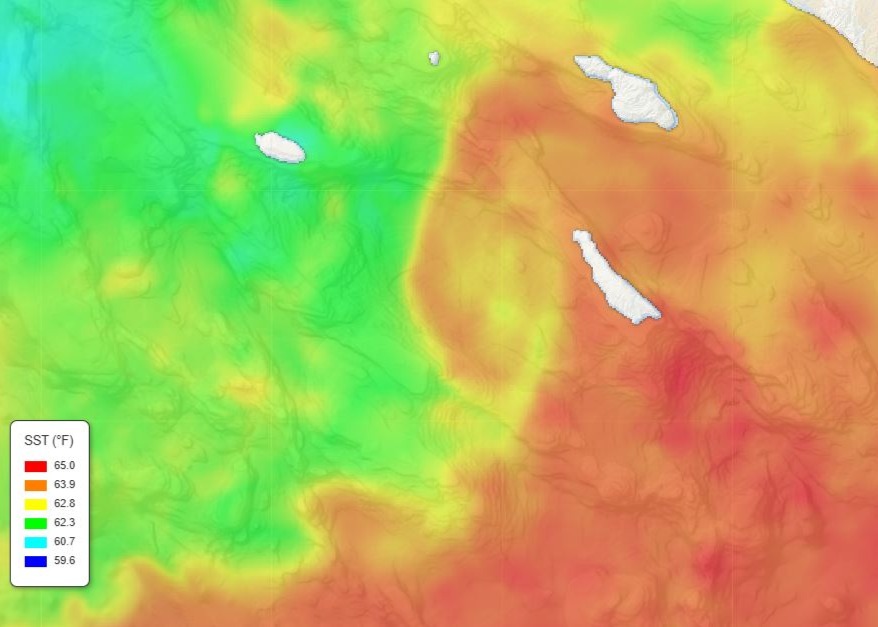
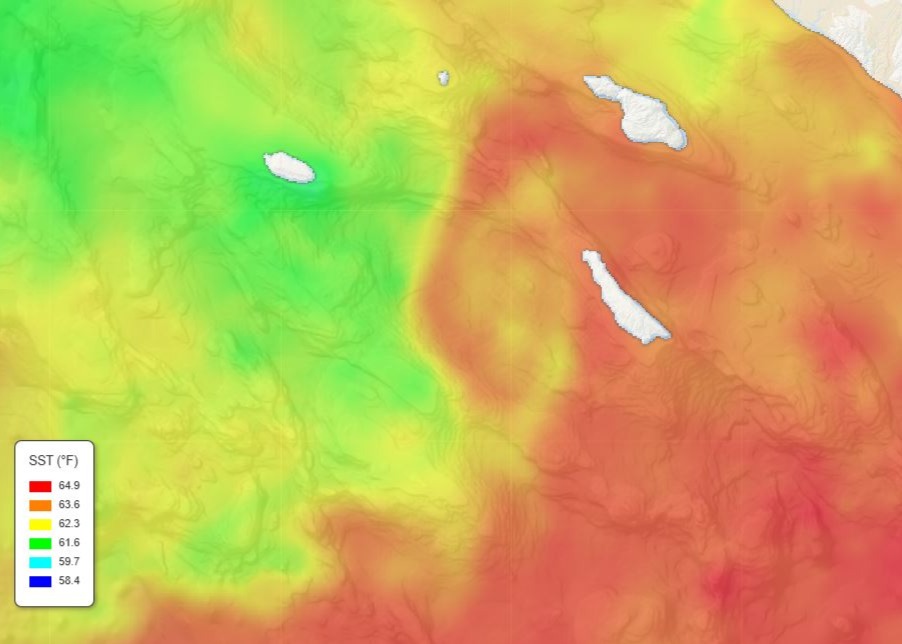
- SST Chart — Find what species are in range
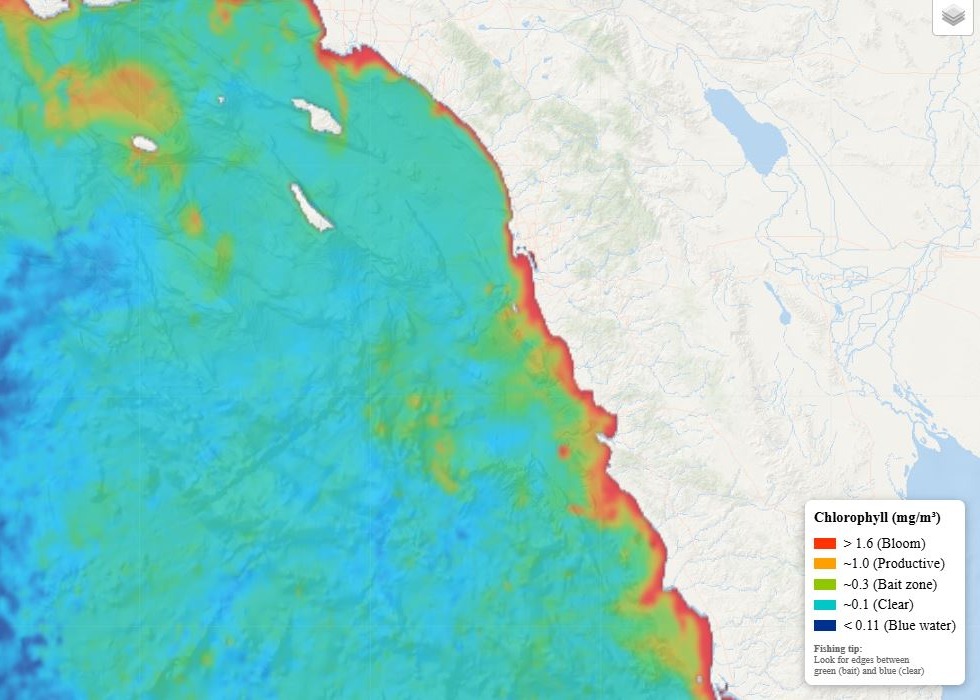
- Chlorophyll Map — Locate bait concentrations
- Fleet Tracker — See what’s biting on the boats
- Marine Weather — Check conditions
- AI Fishing Predictions — Data-driven forecasts for SoCal
- SD Fishing Season Calendar — What’s biting this month
Related Guides
- Best Fishing Line by Pound Test
- Best Fishing Knots
- How to Tie a Palomar Knot
- Best Hooks by Species
- Circle Hooks vs J Hooks
- Spinning vs Conventional Reels
- Surface Iron Fishing Guide
- Best Yellowtail Jigs & Irons
- Best Tuna Jigs
- Best Lures for Dorado
- Best Lures for Tuna
- Best Poppers for Tuna
- Best Swimbaits for Halibut
- Best Reel for Yellowtail
- Best Reel for Bluefin Tuna
- Best 20lb Reels
- Best 30lb Reels
- Best 40lb Reels
- Best 7-Foot Offshore Rods
- Best 8-Foot Offshore Rods
- Best Rod & Reel Combos for SoCal
- Best Surf Fishing Reels
- Best Surf Casting Rods
- Carolina Rig Setup
- Fly-Line Rig for Tuna
- Finding Temperature Breaks
- Overnight Trip Packing List
Tight lines!