• Best Water Temperature for Wahoo Fishing

    Best Water Temperature for Wahoo Fishing

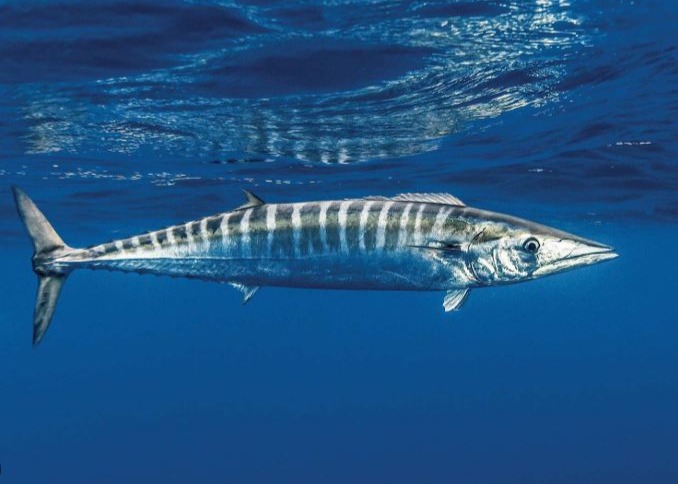
    Wahoo are one of the fastest fish in the ocean — and they demand the warmest water of any species you’ll target from a Southern California sportfishing boat. If you’re not fishing in 72–82°F water, you’re probably not fishing for wahoo.

    These fish are creatures of tropical and subtropical currents. Off our coast, that means long-range trips to Baja California banks, or the rare warm-water years when wahoo push north into SoCal waters. Either way, water temperature is the single best indicator of whether wahoo are in the area.

    The Wahoo Temperature Window

    Temperature Range Activity Level Notes
    Below 70°F Very low Wahoo are rarely found — too cold for this species
    70–72°F Low–moderate Fringe water; possible but not reliable
    72–76°F High Active feeding, especially near structure and current edges
    76–82°F Peak Prime wahoo water — this is the sweet spot
    Above 82°F Moderate Still fishable but wahoo may go deep to find cooler water

    The 76–80°F range is where wahoo fishing is at its best. This is significantly warmer than bluefin tuna (60–68°F) or yellowtail (62–72°F), which is why wahoo are primarily a long-range target for SoCal anglers.

    Where to Find Wahoo Water

    From a Southern California port, you’ll typically need to head south to find consistent 72–82°F water. Here are the primary wahoo grounds:

    Guadalupe Island. Located about 150 miles southwest of Ensenada, Guadalupe sits at the intersection of warm currents from the south and cooler California Current water. When the warm side pushes in, wahoo stack up around the island’s structure. Check the SST charts for a defined warm-water edge near the island.

    Hurricane Bank (Banco Hurricane). One of the premier wahoo spots in the Pacific, located roughly 250 miles south of Cabo. Long-range boats out of San Diego run here during late summer and fall. Water temps consistently hold in the 78–82°F range.

    San Benedicto and the Revillagigedo Islands. Deep offshore seamounts surrounded by warm tropical water. These are multi-day long-range destinations that produce wahoo alongside yellowfin tuna and giant trevally.

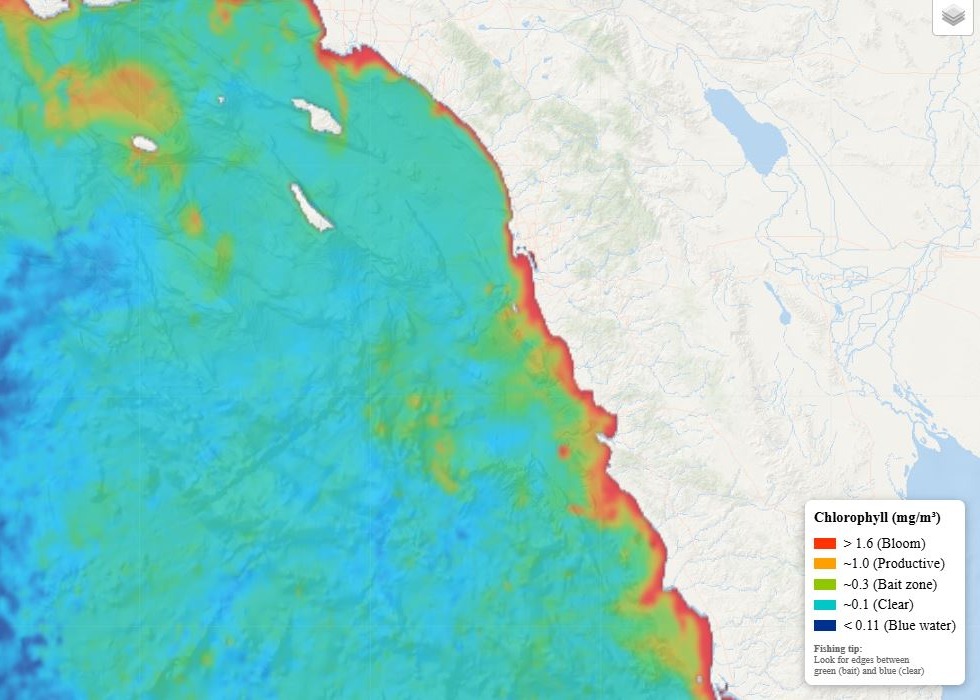
    Outer banks off Baja. Seamounts and ridges like Uncle Sam Bank, Thetis Bank, and the Finger Bank can hold wahoo when warm currents push through. Use chlorophyll maps to identify productive edges where warm, clear water meets nutrient-rich upwelling zones.

    SoCal (rare years). During El Niño events or exceptionally warm seasons, wahoo occasionally push as far north as the Coronado Islands, San Clemente Island, or even Catalina. These events are unpredictable — but when you see 74°F+ water at the offshore islands on the SST chart, it’s worth paying attention to fish reports. You may also find dorado and yellowfin in the same warm-water push.

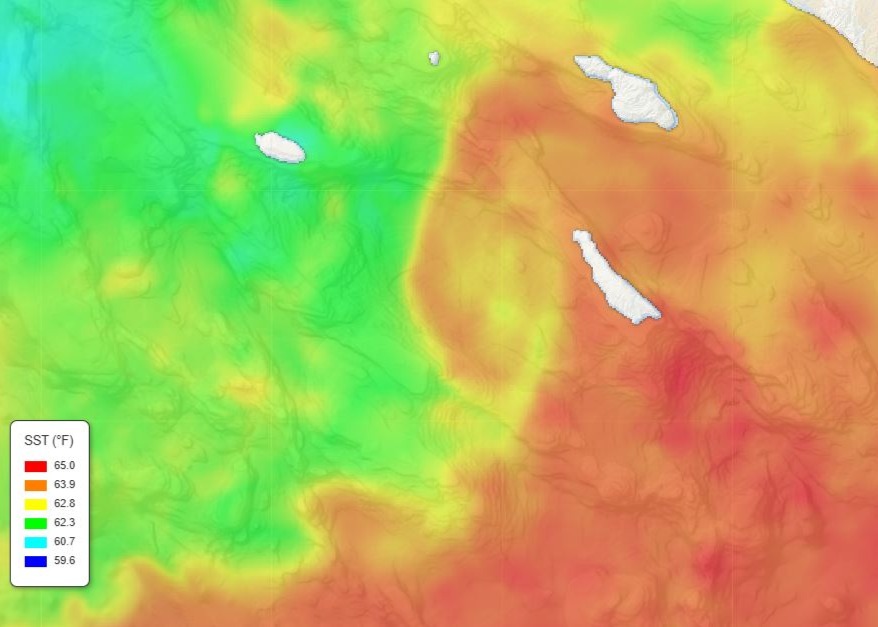
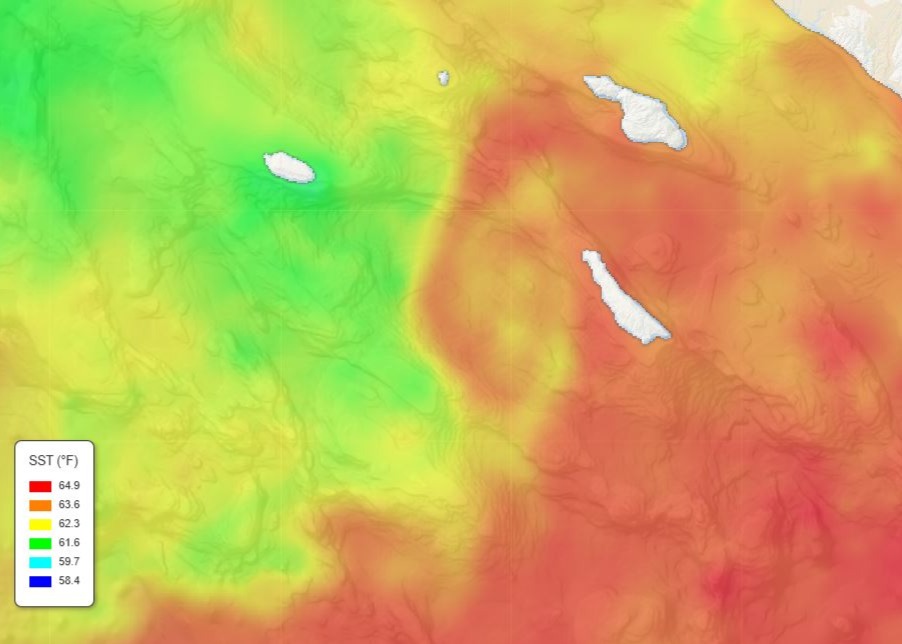
    How to Use SST Charts for Wahoo

    Wahoo fishing and SST charts go hand in hand. Here’s what to look for:

    Find the 74–80°F contour line. Pull up the SST chart and look for where this temperature range intersects with underwater structure — seamounts, banks, island drop-offs, and ridges.

    Look for temperature breaks. Wahoo love edges. A sharp transition from 72°F to 78°F over a short distance concentrates bait and predators. These temperature breaks are where you want to focus your trolling passes.

    Watch for warm-water intrusions. Tongues of warm water pushing north or onshore can bring wahoo into areas they don’t normally inhabit. Track these intrusions day by day on the SST chart — if the warm water is expanding and holding, wahoo may follow it in.

    Cross-reference with chlorophyll. Wahoo prefer clean, blue, low-chlorophyll water. If you see high chlorophyll (green water) at the right temperature, that’s more likely yellowfin tuna or dorado water. Wahoo want warm AND clear. The chlorophyll map makes this easy to check — see our chlorophyll map guide for how to read the edges.

    Wahoo Fishing Techniques

    High-speed trolling is the primary method. Wahoo are built for speed — they can hit 60 mph in short bursts. Trolling at 8–14 knots with skirted lures, Rapala X-Rap Magnums, or rigged ballyhoo behind wire leaders is the standard approach. This is similar to trolling for tuna but at significantly higher speeds — wahoo want the lure moving fast.

    Wire leaders are essential. Wahoo have razor-sharp teeth that will slice through even heavy fluorocarbon in a fraction of a second. Use single-strand wire or braided wire leaders in the 60–90lb range. This is the one species where fluorocarbon leader alone won’t cut it — literally.

    Vertical jigging over structure produces big wahoo. Drop a heavy speed jig (200–400g) to the bottom over a seamount or bank, then work it back up with fast, aggressive retrieves. Knife jigs and heavy flat-falls in chrome or blue/silver work well. This is where a quality 40lb+ conventional reel earns its keep — you need both speed to work the jig and stopping power when a wahoo screams back toward the structure.

    Live bait on the drift. When wahoo are in the area but not responding to trolling, slow-drifting live mackerel or skipjack on a wire leader can trigger strikes. Fish them at mid-depth using a slider rig with a wire bite leader. Use a J hook rather than a circle — wahoo hit and run fast, and you need the instant hookset.

    Wahoo Gear and Lure Guides

    Wahoo require stout tackle. Their initial run is explosive and their teeth will destroy anything that isn’t purpose-built for the job. Here’s the setup plus links to our detailed guides:

    Reel: A quality conventional reel in the 30–50lb class with a smooth drag and at least 400 yards of capacity. Two-speed reels are ideal for switching between high-speed retrieves and grinding power. The Shimano Talica 12 is a proven wahoo reel.

    Rod: A 6–7 foot heavy-action rod with fast tip for trolling, or an 8-foot rod for jigging applications. See our rod and reel combo guide for complete pairings.

    Line: 50–65lb braided line with a heavy fluorocarbon wind-on leader, topped with wire. See our fishing line guide for specific braid recommendations.

    Terminal: Always wire leader for wahoo. Palomar knots for the fluoro sections and haywire twists for wire connections. For the hook, see our hooks by species guide — J hooks on trolling lures, assist hooks on vertical jigs.

    Plan Your Trip

    Wahoo trips require planning — you need to know the water is right before committing to a long-range voyage. Start with the data:

    Related Guides

    Tight lines!

  • How to Use Chlorophyll Maps to Find Fish Offshore

    How to Use Chlorophyll Maps to Find Fish Offshore

    🌊 View Today’s Chlorophyll Map

    Check the current chlorophyll conditions for SoCal and Baja right now on our free animated chlorophyll map — updated daily with NOAA satellite data. Pair it with the Animated SST chart or AI Enhanced Regional SST charts to find where bait is stacking up along temperature breaks.

    Most offshore anglers know about SST charts — sea surface temperature maps that show water temperature and temperature breaks. Fewer know about chlorophyll maps, and that’s a missed opportunity. Chlorophyll data tells you where the food chain starts, and ultimately, where gamefish are feeding.

    If SST charts tell you where fish are comfortable, chlorophyll maps tell you where fish are eating. Used together, they’re the most powerful combination of satellite data available to recreational anglers.

    What Chlorophyll Maps Show

    Chlorophyll is the green pigment in phytoplankton — microscopic plants floating at the ocean surface. Satellites measure the color of the ocean from space. Green water has high chlorophyll (lots of phytoplankton). Blue water has low chlorophyll (clear, nutrient-poor water).

    Why does this matter for fishing? Because the ocean food chain works like this:

    Phytoplankton → Zooplankton → Baitfish → Gamefish

    Areas with high chlorophyll are producing plankton, which attracts krill and small organisms, which attract anchovies, sardines, and squid, which attract tuna, yellowtail, dorado, and everything else you’re trying to catch. Chlorophyll maps show you the foundation of that food chain from 400 miles up.

    How to Read a Chlorophyll Map

    Chlorophyll maps on fishing-reports.ai use a color scale from blue to green:

    • Dark blue — Very low chlorophyll. Clear, deep oceanic water. Low productivity. Fish density is usually low unless there’s other structure (temperature breaks, seamounts, debris).
    • Light blue / cyan — Moderate chlorophyll. Transitional water. This zone often marks the boundary between productive coastal water and clean offshore water — a key area for fishing.
    • Green / yellow-green — High chlorophyll. Productive, nutrient-rich water. Baitfish concentrations are likely. Nearshore and upwelling areas typically show this.
    • Bright green / yellow — Very high chlorophyll. Extremely productive — often associated with active upwelling zones, river mouths, or nutrient plumes. Water may be too murky for pelagic fishing but holds bait.

    The Money Zone: The Chlorophyll Edge

    The single most valuable feature on a chlorophyll map is the chlorophyll edge — the boundary where green, productive water meets clean blue water. This is the fishing equivalent of the tree line at the edge of a field. Prey congregates along the edge, and predators patrol it.

    Here’s why the edge is so productive:

    • Bait stacks up — Small fish feed in the green productive water and get pushed against the boundary by currents. The edge acts as a concentration line.
    • Predators prefer clean water — Tuna, dorado, and billfish generally prefer the cleaner blue side where they can see and hunt effectively. They work the edge, darting into the green side to feed.
    • Current convergence — Chlorophyll edges often mark the boundary between two water masses moving at different speeds or directions. This convergence zone concentrates floating debris, kelp paddies, and bait.

    On the chlorophyll map, look for a sharp transition from green to blue. The sharper and more defined the edge, the better. A gradual fade from green to blue over 50 miles is less useful than a crisp boundary over 5 miles.

    Combining Chlorophyll with SST Charts

    This is where the real power lies. Each data layer tells you something different, and together they paint a complete picture:

    Step 1: Check the SST Chart

    Open the SST chart and identify water in the right temperature range for your target species. (See our species temperature guides for bluefin tuna, yellowfin tuna, dorado, yellowtail, white seabass, and halibut.)

    Step 2: Check the Chlorophyll Map

    Switch to the chlorophyll layer and find the chlorophyll edge in the same area. Where is the green-to-blue transition relative to the water temperature you identified?

    Step 3: Find the Overlap

    The magic spot is where three things intersect:

    1. Water temperature in the right range for your target species
    2. A chlorophyll edge (green meets blue)
    3. A temperature break (warm meets cool)

    When all three line up in the same area, you’ve found a high-probability fishing zone. This combination concentrates bait, provides the right thermal environment, and creates structure in the open ocean where gamefish feed.

    Step 4: Check the Fleet

    Confirm your analysis by looking at the fleet tracker. Are boats heading to or fishing in the area you identified? If the satellite data and the fleet agree, you’ve found the bite.

    Chlorophyll Patterns for Each Species

    Bluefin Tuna

    Bluefin often work the chlorophyll edge from the blue side. They’re comfortable in moderate-to-clean water and will push into greener water to feed on bait schools. Look for the chlorophyll edge where it intersects with the 62–68°F temperature range. Bluefin tend to hold along the edge rather than ranging through open blue water. When you find them, surface iron, poppers, and trolling lures are how you capitalize — have your tuna setup rigged with 50–65lb braid and ready before you reach the edge. For live bait along the edge, circle hooks on a fly-line rig are deadly.

    Yellowfin Tuna and Dorado

    Both species prefer the clean blue side of the edge in water 72°F+. They’re more sight-oriented feeders that want visibility. The best dorado fishing is often a few miles on the blue side of the chlorophyll edge, especially when kelp paddies or debris are present. The edge concentrates the floating structure that dorado associate with. Run a trolling spreadcedar plugs and feathers — along the blue side of the edge while searching for paddies. When you find fish on a paddy, switch to casting: surface iron (Tady 45) and poppers draw explosive strikes from both species. A 20lb spinning setup handles dorado, but size up to a 40lb class if yellowfin are in the mix.

    Yellowtail

    Yellowtail are less picky about water clarity than tuna or dorado. They’ll feed comfortably in greener, more productive water — especially around kelp beds and structure where chlorophyll levels are naturally higher. For yellowtail, the chlorophyll data is most useful for identifying areas of strong upwelling (very high chlorophyll) that concentrate squid and baitfish near structure. When you find 62–70°F water with high chlorophyll near islands or kelp, bring your iron and jigs. A 30lb class setup with 40lb braid handles everything from casting iron at boils to yo-yoing structure. See our hooks guide for the right hook sizes.

    White Seabass

    White seabass thrive in the greener, more productive water that other pelagics avoid. They’re often caught in areas with moderate-to-high chlorophyll where squid are spawning. If the chlorophyll map shows a productive zone near islands or kelp beds in 59–65°F water during spring, that’s white seabass territory. Fish the kelp edges at dawn with a slider rig and live squid on a 4/0–6/0 circle hook. A 20–25lb class setup with 30lb braid and 25lb fluoro leader is the standard. See our hooks guide for specific models.

    Halibut

    For inshore species like halibut, chlorophyll maps help you identify where bait is stacking up along the coast. High chlorophyll nearshore — especially near sandy flats and bay mouths — means baitfish concentrations that pull halibut into shallow water. This is when swimbaits and Carolina rigs on the sandy flats produce best. From shore, a 4000–5000 spinning reel on a 9–10 foot surf rod with 20lb braid covers it. See our halibut surf fishing guide for beach-specific techniques.

    Common Mistakes When Reading Chlorophyll Maps

    Fishing in the green — New users see high chlorophyll and think “bait = fish.” But if you’re targeting tuna or dorado, the green water itself is often too murky. Fish the edge, not the middle of the green zone.

    Ignoring the time lag — Chlorophyll responds to nutrients with a delay. An upwelling event might take 3–7 days to produce a visible chlorophyll bloom. And baitfish may take another few days to aggregate. A brand-new upwelling plume might not hold fish yet, but one that’s been established for a week is worth fishing.

    Cloud cover gaps — Like SST charts, chlorophyll maps are satellite-based and blocked by clouds. If the latest image is patchy, check the previous day’s image or use the multi-day composite view on the charts page.

    Trusting it alone — Chlorophyll maps are one piece of the puzzle. Always combine with SST data, fleet intel, swell conditions, and fishing reports. No single data source tells the whole story.

    Seasonal Chlorophyll Patterns in SoCal

    The chlorophyll picture off Southern California changes throughout the year:

    Winter–Spring (Jan–Apr): Strong coastal upwelling produces high chlorophyll nearshore. The green water extends well offshore, and the chlorophyll edge may be 30–50+ miles out. This is when the ocean is most productive overall — good for bait production that fuels the spring and summer fisheries. Prime time for white seabass in the green water and early-season yellowtail near structure.

    Late Spring–Summer (May–Aug): Upwelling relaxes, and the chlorophyll edge moves closer to shore. Offshore water becomes cleaner and bluer. Clear temperature and chlorophyll edges form between the coastal upwelling zone and the clean offshore water — these are prime fishing boundaries for bluefin, yellowfin, and dorado as warm water pushes in.

    Fall (Sep–Nov): Chlorophyll levels decrease as upwelling weakens and surface water warms. The green-to-blue transition can be quite sharp and close to shore. Look for remaining productive pockets around the islands and banks. Late-season dorado and yellowfin concentrate along these tightening edges.

    Plan Your Trip

    Ready to add chlorophyll data to your pre-trip planning? Start here:

    Related Guides

    Tight lines!

  • San Diego Fishing Season Calendar — Complete Month-by-Month Guide

    San Diego Fishing Season Calendar — Complete Month-by-Month Guide

    San Diego is one of the few places in the world where you can fish offshore every month of the year. The species change with the seasons as water temperatures rise and fall, bringing waves of gamefish from the tropics to the north and resident species through their annual cycles. Knowing what’s in season — and what water temperature triggers each bite — is the difference between an epic trip and a slow one.

    Here’s a month-by-month breakdown of what to expect from San Diego’s sportfishing fleet, the water temperatures that drive each fishery, and how to use ocean condition data to time your trips.

    At a Glance: San Diego Fishing Calendar

    Month Avg SST Primary Targets Trip Types
    Jan 57–60°F Rockfish, Yellowtail, Lingcod ½ day, ¾ day
    Feb 57–59°F Rockfish, Yellowtail (squid), Lingcod ½ day, ¾ day
    Mar 58–61°F Yellowtail, White Seabass, Rockfish ¾ day, 1.5 day
    Apr 59–63°F Yellowtail, White Seabass, early Bluefin ¾ day, full day, 1.5 day
    May 61–65°F Bluefin, Yellowtail, White Seabass Full day, 1.5 day, overnight
    Jun 63–67°F Bluefin, Yellowtail, Calico Bass Full day, overnight, multi-day
    Jul 66–72°F Bluefin, Yellowfin, Yellowtail, Dorado All trip types
    Aug 68–74°F Bluefin, Yellowfin, Dorado, Wahoo All trip types
    Sep 69–75°F Bluefin, Yellowfin, Dorado, Wahoo All trip types — peak variety
    Oct 67–72°F Bluefin (trophies), Yellowfin, Dorado Full day, overnight, multi-day
    Nov 63–68°F Bluefin, Yellowtail, Rockfish Full day, ¾ day, 1.5 day
    Dec 59–63°F Rockfish, Yellowtail, Lingcod ½ day, ¾ day

    Winter: December through February

    Water temperature: 57–62°F

    Winter is bottom fishing season. The offshore pelagics have largely moved south, and the fleet focuses on rockfish, lingcod, and sheephead on the local reefs and structure. But winter isn’t all about bottom fish — yellowtail often stick around the islands and local kelp beds, especially when squid are spawning.

    What’s biting:

    • Rockfish — The bread and butter of winter fishing. Vermilion, reds, coppers, and bocaccio on the local reefs. Half-day boats produce consistent limits.
    • Lingcod — Big, aggressive predators that hit swimbaits and live bait fished near the bottom. Fish to 30+ lbs are landed every winter.
    • Yellowtail — When squid spawning activity peaks near the islands (San Clemente, Catalina), yellowtail stack up to feed on them. The squid bite requires specialized techniques (dropper loop rigs, live squid bait), but produces some of the biggest yellowtail of the year — fish over 30 lbs are common. Check the fleet tracker to see if overnight boats are running to the islands.
    • Bonito — Still around in fishable numbers, especially on half-day boats near Point Loma and La Jolla. Great fight and fun on light tackle.

    SST tip: Look at the SST charts for pockets of warmer water (61°F+) near the islands. Warmer pockets in winter often hold better yellowtail fishing.

    Spring: March through May

    Water temperature: 58–65°F

    Spring is transition season and arguably the most exciting time to watch the SST charts. Water temperatures are climbing, and every degree brings new possibilities. White seabass arrive, yellowtail fishing heats up, and the first bluefin of the year may show on the outer banks.

    What’s biting:

    • Yellowtail — As water climbs past 62°F, yellowtail fishing transitions from the winter squid bite to the spring/summer bait bite. Fish move from the islands to the local kelp beds and Coronado Islands. Iron jigs and live sardines become the go-to.
    • White Seabass — The prized catch of spring. White seabass push into SoCal waters when temps hit 59–63°F, usually targeting squid. They’re most commonly caught on live squid fished near kelp beds and structure, especially at night or early morning. The fishery is heavily dependent on squid availability — check if the squid fleet is active.
    • Bluefin Tuna — Early-season bluefin start showing in April or May as water nears 62°F on the outer banks. These are often the first big-fish reports of the year and generate huge excitement. Watch the SST charts for temperature breaks forming along the 60–65°F isotherms offshore.
    • Calico Bass — Spring bass fishing on the kelp beds is outstanding as the fish come shallow to feed. Live sardines on the kelp edge or swimbaits for the bigger specimens.
    • Halibut — California halibut move into shallower sandy areas to feed in spring. Half-day boats pick them up on the flats near Point Loma and Mission Bay.

    SST tip: Spring is all about temperature breaks. Coastal upwelling creates sharp cold/warm boundaries that concentrate bait and gamefish. A 3°F break in April is a fish highway.

    Summer: June through August

    Water temperature: 63–74°F

    Peak season. The widest variety of species, the most boats on the water, and the best conditions for offshore fishing. The warm water has arrived, and with it come the pelagics that make SoCal sportfishing world-class.

    What’s biting:

    • Bluefin Tuna — The main event. Summer bluefin fishing from San Diego is legendary. Schools show up from the local banks out to San Clemente and Tanner Bank. Fish from 20 lbs to 200+ lbs are caught on flylined sardines, surface iron, kite, and trolled lures. The fleet tracker is essential for finding where the bite is.
    • Yellowfin Tuna — Arriving in July when water temps hit 72°F, yellowfin add another dimension. Often found mixed with bluefin on the same grounds, or further offshore on warm water intrusions. Yellowfin are typically more aggressive biters than bluefin.
    • Dorado — Show up mid-to-late summer as 72°F+ water pushes in. Found on kelp paddies and debris offshore. The colorful fight and excellent table fare make them a favorite.
    • Yellowtail — Still going strong on the islands, kelp beds, and Coronado Islands. Summer yellowtail tend to be more willing biters than spring fish.
    • Calico Bass & Barracuda — Excellent inshore fishing all summer. Half-day and 3/4-day boats produce consistent action.

    SST tip: Summer produces the most complex SST charts of the year — warm water intrusions, eddies, upwelling plumes, and temperature breaks everywhere. Use the SST charts and chlorophyll maps together to find where warm offshore water meets productive coastal water. That intersection is where the action concentrates.

    Fall: September through November

    Water temperature: 63–75°F

    Many veteran anglers consider fall the best season of all. Water temperatures peak in September, bringing the widest species variety of the year. As temps slowly drop through October and November, the remaining warm-water species are at their largest.

    What’s biting:

    • Bluefin Tuna (trophies) — Fall bluefin are the heaviest of the year. Fish that have been feeding all summer are at peak weight, and 200+ lb catches are most common in September and October. As water cools, the window narrows but the quality increases.
    • Yellowfin Tuna — Peak yellowfin action. September and October often produce the highest yellowfin counts of the year, sometimes mixing with bluefin on the same grounds.
    • Dorado — Late-season dorado tend to be bigger (bull dorado to 40+ lbs) as smaller fish have moved south. Still on paddies and debris in 72°F+ water.
    • Wahoo — The most exotic catch in SoCal waters. Wahoo prefer 74°F+ water and show up in September and October during warm years, particularly around the outer islands and offshore banks. They’re fast, powerful, and incredible table fare.
    • Yellowtail — Fall yellowtail fishing can be outstanding, especially as fish migrate south and stack up on local structure.

    SST tip: Watch the SST charts for the warm water retreat. As the 72°F water pulls offshore and south through October and November, the warm-water species retreat with it. The fleet tracker shows which boats are still running offshore — when they stop going, the warm water is gone.

    Species Temperature Quick Reference

    For detailed temperature guides on individual species, see our in-depth articles:

    Species Preferred Temp (°F) SoCal Season Temp Guide
    Bluefin Tuna 60–72°F Apr–Nov Read Guide
    Yellowfin Tuna 72–82°F Jul–Oct Read Guide
    Yellowtail 62–70°F Year-round (peak Mar–Oct) Read Guide
    Dorado (Mahi Mahi) 72–82°F Jul–Oct Read Guide
    Wahoo 74–84°F Sep–Oct (warm years) Read Guide
    White Seabass 59–66°F Mar–Jun Read Guide
    Rockfish 52–65°F Year-round
    Lingcod 50–60°F Nov–Mar (best)
    Calico Bass 60–72°F Year-round (peak May–Oct)
    California Halibut 58–68°F Mar–Sep Read Guide
    Barracuda 63–72°F Apr–Oct

    How to Use Ocean Data to Plan Your Trip

    The beauty of understanding seasonal temperature patterns is that you can combine that knowledge with real-time data to make smarter decisions about when and where to fish. Here’s the workflow:

    1. Know what’s in season — Use the calendar above to narrow down your target species based on the month.
    2. Check the SST charts — Visit the charts page to see current water temperatures. Are they running warm or cool for the time of year? That shifts everything earlier or later.
    3. Look for structure in the data — Temperature breaks, warm water intrusions, chlorophyll edges, and eddies all concentrate fish. Our guides on reading SST charts and finding temperature breaks show you exactly what to look for.
    4. Watch the fleet — The fleet tracker shows where San Diego’s sportfishing boats are heading and how long they’re staying on the grounds. This is real-time intelligence on where the bite is.
    5. Check the AI forecast — Our AI prediction model synthesizes SST, chlorophyll, swell, wind, and historical catch data to give you a daily forecast of fishing conditions.

    The anglers who check conditions before choosing their trip consistently outperform those who book randomly. Water temperature data won’t guarantee fish on the end of your line, but it stacks the odds heavily in your favor.

  • Best Water Temperature for Bluefin Tuna Fishing

    Best Water Temperature for Bluefin Tuna Fishing

    Pacific bluefin tuna are the most sought-after gamefish in Southern California, and water temperature is one of the best predictors of where you’ll find them. Unlike most pelagic species that need warm tropical water, bluefin are cold-water tolerant and will feed in a surprisingly wide temperature range — which is exactly why they show up off San Diego when other warm-water species haven’t arrived yet.

    Here’s what you need to know about bluefin tuna and water temperature to plan your next trip.

    The Quick Answer: Ideal Temperature Range

    Bluefin tuna are most actively caught in water temperatures between 60°F and 72°F (15.5–22°C). The sweet spot for Southern California is 62–68°F, which is when the fish are feeding aggressively and most accessible to the sportfishing fleet.

    That said, bluefin have been caught in water as cold as 55°F and as warm as 78°F off our coast. Their ability to thermoregulate — maintaining a body temperature above ambient water — gives them a much wider range than yellowfin or dorado. This is a key reason bluefin can be targeted nearly year-round in SoCal and Baja waters.

    Temperature Ranges and What to Expect

    The Prime Zone: 62–68°F

    This is the bread-and-butter range for SoCal bluefin fishing. In this range, bluefin are typically:

    • Feeding on the surface or in the upper water column
    • Responsive to flylined bait and topwater techniques like surface iron and poppers
    • Holding on temperature breaks and along current edges
    • Found in schools mixing smaller 20–40 lb fish with occasional larger specimens

    When you see this range on the SST chart, pay close attention to where the 62°F and 68°F isotherms sit relative to known banks and structure.

    Cool Side: 58–62°F

    Bluefin absolutely feed in the low 60s and upper 50s, but the bite changes character. Fish in cooler water tend to be:

    • Deeper in the water column (50–150 feet down)
    • More responsive to kite fishing, slow-trolled mackerel, and deep jigging with flat-falls
    • Less likely to show on the surface or feed on flylined sardines
    • Often larger-grade fish — winter/spring giants in the 100–300 lb class

    Don’t write off a trip just because the SST chart shows 59°F. Some of the biggest bluefin caught off San Diego have come in water that would send yellowtail south.

    Warm Side: 68–74°F

    As water pushes into the upper 60s and low 70s — typically late summer through fall — bluefin often share the water with yellowfin tuna, dorado, and wahoo. In this range:

    • Bluefin may become more selective and harder to hook as bait options increase
    • Surface iron, poppers, and trolled lures become more effective
    • Fish often push to deeper, cooler pockets below the thermocline while feeding up on bait schools
    • Mixed bags are common — you might hook bluefin, yellowfin, and dorado on the same stop

    Extended Range: Below 58°F or Above 74°F

    Bluefin can be caught outside the typical range, but these are generally edge cases. Below 58°F, the fish are usually deep and scattered. Above 74°F, you’re more likely targeting yellowfin, with bluefin as an incidental catch around deeper structure or thermocline edges where cooler water sits below the warm surface layer.

    Bluefin Temperature Preferences by Season in SoCal

    Winter (December–February): 57–62°F

    The conventional wisdom is that bluefin disappear in winter, but that’s not always true. In warmer years, fish linger off the Coronado Islands and outer banks in water around 60°F. These tend to be bigger fish — the kind that make multi-day trips worthwhile. Check the fleet tracker to see if boats are making the run south. If they are, the bluefin are still around.

    Spring (March–May): 60–65°F

    The bluefin season traditionally kicks off in spring as water temps climb past 60°F. Early-season fish often show up at the outer banks (9 Mile, 43 Fathom, Coronado Canyon) and along temperature breaks where warmer offshore water meets the cooler coastal upwelling. This is when SST charts become essential — a 2–3°F temperature break can concentrate bait and bluefin along a visible edge. See our guide on how to find temperature breaks for details. Have your bluefin reel spooled with fresh 50–65lb braid before the season starts.

    Summer (June–August): 64–72°F

    Peak season. The widest temperature range and most fish. Bluefin can be found from the local kelp beds out to San Clemente and Tanner Banks, often in massive schools. Surface feeding is common, and flyline bait fishing is at its best. The SST chart during summer usually shows a complex mix of warm and cool water masses — look for the edges and eddies where different water masses meet. Bring your iron setup for surface boils and a trolling spread for covering ground between stops.

    Fall (September–November): 65–72°F

    The water is at its warmest, and this is often when the biggest fish of the year are caught. Fall bluefin have been feeding all summer and can be at peak weight. Trophy fish over 200 lbs are most common in September and October. The SST charts may show the warmest surface temps of the year, but don’t be misled — bluefin will often sit just below the warm surface layer. Look for areas where the warm water is pushed up against cooler upwelled water, especially around the islands.

    How to Use SST Charts to Find Bluefin

    Water temperature is the starting point, not the whole picture. Here’s a practical workflow for using SST charts to narrow down where bluefin are likely to be:

    1. Check the regional SST chart — Look for water in the 60–72°F range within reach of the SoCal fleet (inner and outer banks, island waters, Baja coast)
    2. Find the temperature breaks — Bluefin stack up along edges where temperature changes 2°F or more over a short distance. These breaks concentrate bait and create feeding lanes.
    3. Cross-reference chlorophyll — Green water (high chlorophyll) means plankton, which means bait. Bluefin often work the edge where green productive water meets cleaner blue offshore water. Check the chlorophyll map — see our chlorophyll guide for how to read the edges.
    4. Watch the fleet — Use the fleet tracker to see where boats are fishing and how long they’re staying on a spot. Multiple boats holding position is a strong signal.
    5. Compare the 14-day animation — Conditions change fast. Use the animated SST view to see if a warm water mass is building, holding, or retreating. A stable, warm eddy that’s been in place for several days is more likely to hold fish than a transient warm spot.

    Beyond Temperature: Other Factors That Matter

    Water temperature gets you in the neighborhood. These factors help you narrow it down to the right block:

    Bait presence — Bluefin follow their food. Sardines, anchovies, squid, and flying fish all drive bluefin movements. If you’re marking bait on the sounder in the right temperature range, you’re in the zone.

    Water clarity — Bluefin generally prefer clean blue water over dirty green. The transition zone between blue and green (the “color break”) is often where the action is — see our chlorophyll map guide for identifying these edges from satellite data.

    Current — Moving water concentrates bait. Tidal flow around structure, wind-driven currents, and larger oceanographic features like eddies all create feeding opportunities.

    Moon phase — Some skippers swear by the new moon for bluefin, as darker nights may push fish to feed more aggressively during the day. Full moons can produce good night bites on kite-fished baits.

    Time of day — Dawn and dusk are classic feeding windows. But surface-feeding bluefin on a flat-calm midday are not uncommon in peak season.

    Bluefin Gear and Lure Guides

    Once you’ve found the right water temperature, you need the right gear to land these fish. Bluefin pull harder than any other SoCal species — undersized tackle means lost fish. Here are our complete bluefin guides:

    Quick Reference Table

    Temperature Range Rating What to Expect Best Techniques
    55–58°F Fishable Deep, scattered fish; trophy potential Deep jig, kite, slow-trolled mackerel
    58–62°F Good Early season; fish moving in; bigger grade Kite, flyline with sinker, slow troll
    62–68°F ⭐ Prime Peak activity; surface feeding; best consistency Flyline sardine, surface iron, poppers, troll
    68–72°F Good Late season; mixed with yellowfin/dorado; selective bite Topwater, trolling, chunk, flyline
    72–78°F Fishable Fish often below thermocline; incidental catches Deep jig, deep bait, thermocline edges

    Plan Your Trip

    Planning a bluefin trip? Start by checking current conditions:

    Related Guides

    Tight lines!

  • Best Water Temperature for Dorado (Mahi Mahi) Fishing

    Best Water Temperature for Dorado (Mahi Mahi) Fishing

    Dorado — also called mahi mahi, dolphinfish, or just “green and gold” — are the quintessential warm-water gamefish. Unlike bluefin tuna, which tolerate a wide range of temperatures, dorado have a clear preference: they want warm water. Understanding that preference is the key to timing your SoCal or Baja dorado trip, because when the right temperature water arrives, the dorado arrive with it.

    The Quick Answer

    Dorado prefer water temperatures between 72°F and 82°F (22–28°C). The sweet spot for Southern California fishing is 74–78°F. Below 70°F, dorado are uncommon in our waters. Above 80°F, they’re in their element — which is why Baja and the Sea of Cortez produce dorado nearly year-round.

    In a typical SoCal season, dorado don’t show up until the warm water pushes north in mid-to-late summer, and they disappear as soon as it retreats in fall. Your SST charts are the best tool for tracking exactly when that warm water arrives and where it sits.

    Temperature Ranges and What to Expect

    Below 70°F — Unlikely

    Dorado are tropical fish. In water under 70°F, they simply aren’t around in any numbers. If your SST chart shows the offshore water is still in the 60s, the dorado haven’t arrived yet. Focus on bluefin tuna or yellowtail instead.

    70–74°F — Early Arrivals

    When warm water first pushes into SoCal in late June or July, scattered dorado ride the leading edge. In this range:

    • Fish are often smaller (schoolie 5–15 lb class)
    • They tend to be associated with floating kelp paddies and debris
    • They’re usually mixed with other warm-water arrivals like yellowfin tuna
    • Found primarily offshore — 50+ miles from the coast along warm water intrusions

    74–78°F — Prime Zone ⭐

    This is the sweet spot for SoCal dorado fishing. The water is warm enough to hold consistent numbers, and the fish are aggressive feeders. Expect:

    • Good numbers on kelp paddies, floating debris, and weed lines
    • Mixed sizes from schoolies to bulls over 30 lbs
    • Surface activity — dorado hitting trolled lures, iron, and flylined bait
    • Often found along temperature breaks where warm water meets cooler coastal water

    When you see 74–78°F on the SST charts extending in from offshore, it’s go time.

    78–82°F — Full Tropical Mode

    This is more typical of Baja and Cortez water, but SoCal sees it during strong El Niño years or late-summer warm events. In this range:

    • Dorado are everywhere and feeding aggressively
    • Bull dorado (30–50+ lbs) become more common
    • They may push closer to shore, sometimes within range of half-day boats
    • Wahoo also show up in this temperature band, so you may find them on the same spots

    Above 82°F

    Still great dorado water — this is their natural tropical range. If you’re fishing Baja’s East Cape, Cabo, or the southern Cortez, 82–86°F is standard and dorado will be resident around structure, FADs, and bait concentrations year-round.

    When Do Dorado Show Up in Southern California?

    The dorado “season” in SoCal is almost entirely dictated by water temperature. Here’s the typical timeline:

    June: Scouting the Charts

    Warm water (70°F+) usually hasn’t reached SoCal yet, but it’s building offshore and along the Baja coast. Check the SST charts weekly to track warm water intrusions pushing north. Long-range boats fishing Baja may already be on dorado.

    July: First Fish Arrive

    The leading edge of 72–74°F water typically reaches the outer banks and offshore paddies by mid-July. This is when the first dorado counts start appearing on the fleet tracker from overnight and 1.5-day boats. The fish are often offshore — 60–100 miles out — associated with warm water fingers visible on SST charts. Have your trolling spread ready — cedar plugs and feathers behind the boat while you search for paddies.

    August–September: Peak Season

    The warmest water of the year. If the SST charts show 74–80°F water within 30–60 miles of San Diego, dorado fishing should be excellent. This is when full-day and even 3/4-day boats can reach them. The fleet tracker will show boats concentrating on productive areas. A 20lb class spinning setup with surface iron and poppers is all you need — dorado are aggressive enough that lure selection is less important than finding the right water.

    October: Late Season Trophies

    As the water begins to cool, dorado numbers thin but the remaining fish tend to be larger. Bull dorado that have been feeding all summer are at their heaviest. Watch the SST charts — as long as you can find pockets of 72°F+ water, dorado will be there. Step up to a medium-wire circle hook in 3/0–4/0 for big bulls on live bait — see our hooks guide for specifics.

    November–May: Offseason (Locally)

    Water temps drop below 70°F and dorado move south. But Baja’s Pacific coast, the East Cape, and the Cortez are still producing. If you’re planning a Baja trip, use the SST charts to find the warm water down south.

    How to Use SST and Chlorophyll Charts for Dorado

    Dorado hunting with satellite data is straightforward because they have such a clear temperature preference:

    1. Find the 72°F+ water — Pull up the SoCal SST chart and identify where warm water (orange/red) extends within range of the fleet.
    2. Look for warm water intrusions — Dorado ride fingers of warm water that push inshore from the open Pacific. These intrusions create long, narrow corridors of warm water surrounded by cooler coastal water. Fish concentrate along the edges.
    3. Find the temperature break — The sharp boundary between warm offshore water and cooler coastal water (the temperature break) concentrates bait and predators. This edge is where you want to troll or drift.
    4. Check chlorophyll — Dorado want warm, relatively clean water — but not dead blue water. The transition zone where productive green water meets clean blue water often holds bait and dorado. The chlorophyll maps show this boundary clearly. See our chlorophyll map guide for how to read them.
    5. Track the fleet — Use the fleet tracker to see where overnight boats are heading. If several boats are running to the same area 60–80 miles offshore, they’re likely on warm water and dorado.

    Dorado vs. Other Warm-Water Species

    Dorado share their temperature range with several other species. Knowing the overlap helps you plan:

    Species Preferred Temp (°F) Overlap with Dorado
    Dorado (Mahi Mahi) 72–82°F
    Yellowfin Tuna 72–82°F Nearly identical — often on the same stops
    Wahoo 74–84°F High overlap; wahoo favor slightly warmer
    Bluefin Tuna 60–72°F Cool-side overlap at 70–72°F
    Yellowtail 62–70°F Minimal overlap at 70–72°F

    The takeaway: when you find 74–78°F water with dorado, you’re also likely to find yellowfin tuna and possibly wahoo. It’s no coincidence that the best dorado trips are often mixed-bag trips.

    Dorado Gear and Lure Guides

    Once you’ve found the right water temperature, you need the right gear to capitalize. Here are our complete dorado guides:

    Other Factors That Affect the Dorado Bite

    Floating structure — Dorado are structure-oriented more than almost any other pelagic. Kelp paddies, logs, debris, weed lines, and even a floating bucket can hold fish. When you find the right temperature water, start looking for floating objects.

    Bait — Flying fish are the primary forage for dorado offshore. Sardines, small mackerel, and squid also work. If you see flying fish skipping along the surface, dorado are likely nearby. Trolling lures that imitate small baitfish — cedar plugs and feathers — are the most effective way to cover ground while searching.

    Current — Warm-water eddies and current edges concentrate floating debris and bait, creating natural dorado magnets. The SST charts often show these eddies as circular warm-water features.

    Water color — Dorado like clean, blue-green water. If you’re in muddy or very green water, keep going until the visibility improves. The chlorophyll map helps you identify water clarity before you leave the dock.

    Wind — Light wind days are best for spotting kelp paddies and floating debris. Check the marine weather and swell and wind forecast before you go — in heavy weather, debris is harder to find and dorado tend to scatter.

    Quick Reference Table

    Temperature Rating SoCal Timing What to Expect
    Below 70°F No dorado Nov–Jun Water too cold; target other species
    70–74°F Fair Early Jul Scattered schoolies on paddies; offshore
    74–78°F ⭐ Prime Jul–Sep Good numbers; mixed sizes; aggressive bite
    78–82°F Excellent Aug–Oct (El Niño years) Bull dorado; trophy potential; fish close to shore
    Above 82°F Excellent Baja year-round Resident fish; standard tropical conditions

    Plan Your Trip

    Ready to plan a dorado trip? Start with the current ocean conditions:

    Related Guides

    Tight lines!

  • Fishing The Edges

    Fishing The Edges

    You’ve checked the SST chart, found a sharp temperature break, cross-referenced the chlorophyll map, and run offshore to the coordinates. Now you’re sitting on the edge. What do you actually do?

    Edges — temperature breaks, chlorophyll boundaries, color changes, current seams — are the most productive features in the open ocean. But finding one and fishing one effectively are two different skills. This guide covers how to work an edge once you’re on it: trolling strategy, which side to fish for each species, when to switch from trolling to casting, and how to keep the bite going.

    Why Edges Hold Fish

    Fish don’t spread evenly across the ocean. They concentrate along boundaries for two reasons: food and comfort.

    Baitfish use edges as reference points. In open water with no structure, bait schools have nothing to orient to and spread out. When they encounter a temperature change, a current boundary, or a color break, they travel along it rather than cross it. This funnels scattered bait into defined corridors that predators learn to patrol.

    Gamefish have thermal preferences — a bluefin might prefer 66°F water but will hunt in 63°F water if that’s where the bait is. The edge lets them stage in comfortable temps while making quick forays into adjacent water to feed. You’ll often find fish holding just on the warm side of a break, facing into the cooler water where bait is getting pushed toward them.

    Types of Edges

    Temperature breaks. Where water masses of different temperatures meet. The sharper the transition, the more fish concentrate. A 3°F change over a quarter mile is far more productive than the same change over five miles. See our finding temperature breaks guide for how to identify these on the SST chart before your trip.

    Chlorophyll edges. Where productive green water meets clean blue water. Bait stays near their food source on the green side; predators prefer the visibility of the blue side. The edge gives both what they want, creating a natural ambush zone. See our chlorophyll map guide for reading these from satellite data.

    Color changes. Visible from the boat as a distinct line where green meets blue. This often indicates different water masses meeting and typically corresponds to temperature or chlorophyll boundaries. When you see one on the water, you’re on the edge — start fishing.

    Current seams. Where currents of different speeds or directions meet. Debris, kelp paddies, and bait accumulate along the seam. These sometimes show up on SST imagery as elongated temperature features, but they’re often easier to spot on the water — look for lines of foam, debris, or color change.

    Structure edges. Where the seafloor rises from deep water to a bank, ridge, or seamount. Upwelling along these features creates productive water above. When a temperature break or chlorophyll edge lines up with a structure edge, you’ve found a high-probability zone.

    Which Side Does Each Species Want?

    Knowing which side of the edge your target species prefers tells you where to concentrate your trolling passes and casting efforts.

    Bluefin tuna — Hold on the cooler side in 60–68°F water, darting into warmer or greener water to feed. When you find bluefin on a break, surface iron (Tady 45) and poppers thrown into the boil are the play. For trolling the edge, run cedar plugs and feathers along the cooler side. Have your 40lb+ setup rigged with 50–65lb braid. When fish are on the meter but won’t eat lures, drop a fly-line rig with a circle hook.

    Yellowfin tuna — Prefer the warm side of the edge in 72°F+ water. Less line-shy than bluefin, so brighter trolling lures and faster retrieves work. When mixed with bluefin on the same edge, yellowfin tend to hold slightly warmer and higher in the column.

    Dorado — Warm, clean side in 72°F+ water. Dorado concentrate where the edge collects floating debris and kelp paddies. The edge itself pushes floating structure into pockets and bends, and dorado follow it. Run a dorado trolling spread along the blue side while scanning for paddies — when you find one, switch to casting iron and poppers. A 20lb spinning setup handles dorado perfectly.

    Yellowtail — Less picky about which side. They’ll feed comfortably in greener, more productive water around kelp and structure. Temperature breaks near islands and reefs are yellowtail magnets. Bring your iron and jigs — the Tady 45 for surface boils, flat-falls when they’re deep on structure. A 30lb class setup with 40lb braid covers it.

    White seabass — Productive (green) side of the edge in 59–65°F water, especially where squid are spawning near kelp beds. Fish the kelp edges at dawn with a slider rig and live squid on a 4/0–6/0 circle hook. See our hooks guide for specifics.

    Wahoo — The warmest, cleanest side, 76–82°F. They’re speed hunters that patrol defined boundaries. High-speed trolling (8–14 knots) along the warm side with wire leader is the standard approach.

    How to Work the Edge

    Troll Parallel First

    Run your initial trolling passes along the edge, not across it. This keeps your spread in the productive zone for the entire pass. If you troll perpendicular to the break, your lures spend most of their time in open, unproductive water on either side. Parallel passes also help you map how far the edge extends and where it bends — irregularities are often the hottest spots.

    Note Which Side Produces

    After a few passes, the fish will tell you where they want to be. Mark the GPS coordinates of every strike and look for the pattern — are they consistently on the warm side? The cool side? Right on the line? Adjust your passes to keep the spread in the strike zone.

    Work the Bends and Points

    Edges rarely run perfectly straight. Where the boundary juts out, curves sharply, or creates a pocket, bait tends to collect. These irregularities are the first places to fish and the last places to leave. On the SST chart, these show up as fingers or bumps in the temperature contour line.

    Switch from Trolling to Casting

    When fish show on the surface — boils, birds working, bait getting pushed up — it’s time to stop trolling and start casting. Kill the engines upwind of the activity and drift through. Have your iron rod rigged and ready: Tady 45 with Owner ST-66 trebles for tuna and yellowtail, or a popper when fish are blowing up on top. The first lure in the water gets bit — speed matters more than lure selection in the first 30 seconds of a stop.

    Don’t Abandon It Too Quickly

    An edge that looks dead might just be between feeding windows. If the satellite data shows a strong feature and the fleet tracker has boats nearby, give it time. Pelagics feed in bursts — being in the right place when they switch on matters more than constantly moving to find a new edge.

    Chum the Edge

    If you’re stopped on a meter mark or a recent boil, toss handfuls of live bait over the side while casting. The combination of flylined baits and artificial lures swimming through a chum line is hard for any fish to resist. Have multiple rods rigged — some with circle hooks for bait, some with iron for casting.

    Double Edges: The Highest-Probability Zones

    When a temperature break lines up with a chlorophyll edge — warm water meeting cool water at the same place where green productive water meets clean blue water — you’ve found a “double edge.” These are the best features in the ocean for fishing because bait concentrates along both boundaries simultaneously.

    Triple edges add bottom structure to the equation. A temperature break that sits over a bank or ridge with a chlorophyll edge in the same area is about as good as offshore fishing gets. Every predator in the area will be working that zone.

    Use the SST chart and chlorophyll map together to identify these overlapping features before your trip. See our finding temperature breaks and chlorophyll map guides for the step-by-step workflow.

    Plan Your Trip

    Find today’s edges before you leave the dock:

    Related Guides

    Tight lines!

  • Understanding Upwelling

    Understanding Upwelling

    How Cold Water from Below Creates Hot Fishing Above

    Along the coasts of Baja and Southern California, some of the most productive fishing water doesn’t flow in from somewhere else — it rises up from below. This process, called upwelling, is responsible for the rich marine ecosystem that makes our region one of the best fisheries on the Pacific coast. Understanding how it works helps you predict where the bite will be — and what gear to have ready when you get there.

    The Mechanics of Upwelling

    Upwelling starts with wind. When prevailing winds blow parallel to the coastline, a phenomenon called Ekman transport pushes surface water offshore at an angle. As that surface water moves away from shore, cold water from depth rises to replace it.

    This deep water is fundamentally different from what was at the surface. It’s colder, often by 10 degrees or more, and it’s loaded with nutrients — nitrates, phosphates, and silicates that have accumulated in the deep from decomposing organic matter. When this nutrient-rich water hits the sunlit surface, it fertilizes an explosion of phytoplankton growth.

    That phytoplankton bloom feeds the entire food chain above it. Zooplankton multiply, baitfish arrive to graze, and gamefish follow the bait. A strong upwelling event can transform a biological desert into productive fishing grounds within a week.

    Where Upwelling Happens

    Upwelling isn’t uniform along the coast. It concentrates around specific geographic features.

    Headlands and points. Where the coastline juts out into prevailing winds, upwelling intensifies. Points like Punta Banda, Punta Colonet, and Cabo San Lucas are reliable upwelling hotspots. The cold, green water often extends offshore from these landmarks in visible plumes.

    Submarine canyons. Deep water close to shore makes it easier for upwelled water to reach the surface. Canyons act as conduits, channeling cold water upward along their walls. The edges of these canyons, where upwelled water meets ambient surface water, create distinct temperature breaks.

    Islands and banks. Offshore features can generate localized upwelling when currents flow past them. The downstream side of islands often shows cooler, more productive water. Seamounts and underwater ridges create similar effects — the same structure that generates upwelling also holds yellowtail and white seabass along the edges.

    Reading Upwelling on the Charts

    On the SST chart, active upwelling appears as tongues of cold water extending from the coast or from bathymetric features. The color will be notably cooler than surrounding offshore water — often blue or purple against green or yellow backgrounds.

    The key features to look for:

    Sharp thermal gradients at the upwelling edge. Where the cold upwelled water meets warmer surface water, you get a distinct temperature break. This edge is prime fishing territory — bait concentrates there, and predators patrol it. See our fishing the edges guide for how to work these boundaries once you’re on the water.

    Corresponding chlorophyll blooms. Flip to the chlorophyll map and look for elevated readings in the same area. Fresh upwelling might show cold water but low chlorophyll (the nutrients haven’t spurred a bloom yet). Mature upwelling shows both cold temps and high chlorophyll. Aging upwelling may show the chlorophyll persisting even as water temperatures moderate. See our chlorophyll map guide for how to read these patterns.

    Plume direction. Upwelled water gets pushed offshore and curves with the currents. Tracking where that plume extends helps you find productive edges further from the coast where fishing pressure is lighter.

    Timing the Upwelling Cycle

    Upwelling events follow a cycle that directly impacts fishing quality.

    Days 1–2: Fresh upwelling. Water temps drop sharply, but chlorophyll hasn’t responded yet. Bait may scatter as conditions change rapidly. Fishing can be tough — you have cold, clear water without an established food chain.

    Days 3–5: Building productivity. Phytoplankton respond to the nutrients. Chlorophyll levels climb. Zooplankton populations grow. Bait begins concentrating along the upwelling edges. Fishing improves.

    Days 5–10: Peak conditions. The full food chain is operating. Bait is stacked on the edges, gamefish are actively feeding. Temperature breaks are well-defined. This is the window you want to hit.

    Days 10+: Relaxation. Winds shift, upwelling weakens, surface water warms. The bloom may persist, but the sharp edges soften. Fishing remains decent but becomes less predictable.

    Watching the multi-day trend on the SST chart animation helps you catch the upwelling cycle at its peak rather than arriving too early or too late.

    Which Species Benefit from Upwelling

    Different species relate to upwelling differently. Knowing where each one sits in the upwelling picture tells you what to target — and what gear to bring:

    Yellowtail push up the coast following bait that concentrates along upwelling edges, especially in spring. They feed comfortably in the greener, productive water and don’t avoid it like tuna do. Upwelling zones near islands and reefs are yellowtail magnets. Bring your iron and jigs — the Tady 45 for surface boils, flat-falls for fish on deep structure. A 30lb class setup covers it.

    White seabass thrive in upwelling conditions. The cold, nutrient-rich water triggers squid spawning runs, and white seabass follow the squid into the kelp. When you see mature upwelling (cold water + high chlorophyll) near kelp beds in 58–65°F water during spring, that’s white seabass territory. Fish the kelp edges at dawn with a slider rig and live squid on a 4/0–6/0 circle hook.

    Bluefin tuna work the outer edges of upwelling plumes — where the cold productive water meets warmer offshore water. They stage in the cleaner water and dart into the green side to feed. Look for upwelling edges where temperature hits the 62–68°F sweet spot. Have your tuna setup rigged with 50–65lb braid and iron ready.

    Halibut respond to nearshore upwelling that pushes bait onto sandy flats. When the SST chart shows upwelling bringing water into the upper 50s to low 60s along the coast, halibut move shallow to feed. Swimbaits and Carolina rigs on the sandy flats produce best during these events.

    Dorado and yellowfin prefer the warm, clean side — they avoid the upwelling core but feed along its outer boundary where kelp paddies and debris collect along the current edge. Run a trolling spreadcedar plugs and feathers — along the warm side of the upwelling edge.

    Seasonal Patterns

    Spring (March–May) is the classic upwelling season along the Baja and SoCal coast. Northwest winds strengthen, and regular upwelling events create the productivity that fuels summer fishing. This is when yellowtail push up the coast following the bait, white seabass move into the kelp for squid, and early-season bluefin show up along the outer edges.

    Summer (June–August) sees reduced but localized upwelling. Look for persistent cold spots around known features — these become magnets for bait and fish when surrounding water gets warm and sterile. The contrast between upwelling zones and the warm offshore water creates some of the sharpest temperature breaks of the year.

    Fall (September–November) brings variable conditions. Wind patterns shift, and upwelling becomes less predictable. But fall upwelling events, when they happen, can produce excellent fishing as fish feed heavily before water cools.

    Winter (December–February) generally has the weakest upwelling, but some localized events occur during Santa Ana wind patterns when offshore flow reverses the typical direction. Check the SST chart during and after Santa Ana events — the wind-driven mixing can create unexpected productive zones.

    Practical Application

    Before planning a trip, review several days of SST charts to identify active upwelling zones. Look for cold-water plumes extending from known headlands or structure. Check if those same areas show elevated chlorophyll on the chlorophyll map — that tells you the upwelling has matured enough to build a food chain.

    Target the edges of the upwelling plume rather than the coldest water at its core. The core might be too cold for your target species, while the edges offer the combination of nutrients, bait, and comfortable temperatures that stack fish. See our fishing the edges guide for how to work these boundaries effectively.

    Upwelling is the engine that drives productivity in our coastal waters. Learn to read it on the charts, and you’ll understand why certain spots fire while others stay quiet — and you’ll know where to be when conditions come together.

    Plan Your Trip

    Read the upwelling before you leave the dock:

    Related Guides

    Tight lines!

  • How to Read SST Charts for Fishing

    How to Read SST Charts for Fishing

    🌊 View Today’s SST Chart

    Check today’s water temperatures on our free animated SST chart — updated daily with NOAA satellite data. Pair it with the chlorophyll map and AI enhanced regional charts to find where fish are holding.

    Why SST Charts Matter for Fishing

    Sea surface temperature (SST) charts are one of the most powerful tools in a saltwater angler’s toolkit. They show you where warm and cold water masses meet, where currents are flowing, and ultimately where the fish are likely holding. Learning to read them takes your fishing from guesswork to strategy.

    Whether you’re running offshore out of San Diego chasing bluefin or trolling the Baja coast for yellowtail, understanding what you’re looking at on an SST chart can mean the difference between a wide-open bite and a long boat ride home.

    Understanding the Color Scale

    Every SST chart uses a color gradient to represent water temperature. Typically, cooler water appears in blues and greens while warmer water shows up in yellows, oranges, and reds. The exact temperature each color represents is shown in the chart’s legend — always check it, because the scale changes depending on the region and time of year.

    For Southern California waters in winter, you might see a scale ranging from 56°F to 64°F. In summer, that same region could show 62°F to 74°F. A chart of the Sea of Cortez in August might run from 80°F to 90°F. Context matters.

    What to Look For First

    Don’t get overwhelmed by the full chart. Start with these three things:

    1. Color contrast. Areas where colors change sharply — where deep blue sits right next to bright green, for example — indicate rapid temperature changes over a short distance. These are temperature breaks, and they’re where you want to fish. See our fishing the edges guide for how to work them once you’re on the water.

    2. Warm-water intrusions. Look for tongues or fingers of warmer water pushing into cooler areas. These often indicate current flow bringing warm offshore water closer to the coast, and gamefish follow them inshore. Dorado and yellowfin ride these intrusions, and the edges are where kelp paddies and debris collect.

    3. Eddies. Circular patterns in the temperature data indicate eddies — rotating pockets of water that concentrate bait and plankton along their edges. Warm-core eddies spinning clockwise (in the Northern Hemisphere) are particularly productive for tuna and billfish. The edges of these eddies are where you want to troll and cast iron.

    Satellite Data: What You’re Actually Seeing

    SST charts are built from satellite-mounted infrared sensors that measure the thermal radiation coming off the ocean’s surface. The data represents roughly the top millimeter of water. A few important caveats:

    Cloud cover creates gaps. Infrared sensors can’t see through clouds. If you notice blank spots or oddly smooth areas on a chart, that’s likely cloud contamination. Multi-day composite charts (like our 14-day SST animation) help fill these gaps by layering multiple days of data.

    Surface vs. depth. What the satellite sees is skin temperature. The water 10 or 20 feet down can be significantly different, especially in areas with strong thermoclines. SST charts tell you where to start looking — your fishfinder and temperature gauge tell you the rest of the story. When bluefin are sitting below the thermocline, flat-fall jigs and deep-set baits get down to where the fish are actually holding.

    Morning vs. afternoon. Solar heating can warm the surface by 1–2°F during calm, sunny days. Most satellites pass in the early morning or late evening to minimize this effect, but it’s worth knowing.

    What Temperature Does Each Species Want?

    Once you can read the chart, you need to know what temperature range to look for. Every species has a preferred window — here’s the quick reference for SoCal targets:

    SpeciesPreferred Temp (°F)Sweet SpotGear Guide
    Bluefin Tuna60–72°F62–68°FJigs · Lures · Reels
    Yellowfin Tuna68–78°F72–78°FLures · Poppers
    Dorado72–82°F74–78°FLures · Reels
    Yellowtail62–70°F64–68°FJigs · Reels
    White Seabass58–66°F60–64°FSlider Rig · Hooks
    Halibut56–68°F59–65°FSwimbaits · Carolina Rig
    Wahoo72–82°F76–80°F40lb Reels

    Find the temperature range for your target on the SST chart, then look for breaks within that range. That’s where the fish are concentrated.

    Reading SST Charts by Region

    Southern California

    The SoCal Bight is defined by the interaction between the cold, south-flowing California Current and warmer water pushing up from Baja. In spring and summer, look for warm-water intrusions pushing north past San Clemente Island and into the offshore banks. Bluefin tuna often stage along the leading edge of these warm pushes in 64–68°F water. Have your tuna setup rigged with 50–65lb braid and iron ready before you reach the break.

    Baja Pacific Coast

    The Baja coast features dramatic upwelling zones where cold, nutrient-rich water rises to the surface near headlands and points. Look for tight color gradients near Punta Colonet, San Quintín, and Cedros Island. Yellowtail and white seabass stack up along these upwelling boundaries. The chlorophyll map is especially useful here — upwelling creates bright green productive zones that concentrate bait along defined edges.

    Cabo & Sea of Cortez

    Warm-water species like dorado, wahoo, and marlin key on the warmest water. During summer and fall, look for blue water (80°F+) pushing close to the cape. In the Cortez, temperature breaks can form mid-channel between the Baja peninsula and the mainland — these are highway on-ramps for striped marlin. Run a trolling spreadcedar plugs and feathers — along these mid-channel breaks.

    Putting It Into Practice

    Here’s a simple workflow for planning your next trip using SST data:

    Step 1: Check the regional SST chart for your fishing area. Note any obvious temperature breaks or warm-water intrusions.

    Step 2: Compare today’s chart to the past few days using the 14-day animation. Is warm water pushing in or pulling back? Stable conditions fish better than rapidly changing ones.

    Step 3: Cross-reference with chlorophyll data. High chlorophyll (green water) adjacent to clean blue water is a bait magnet. Where bait stacks up, gamefish follow. See our chlorophyll map guide for the full breakdown.

    Step 4: Factor in the boat reports. Check what the fleet is finding — our fleet tracker shows you where the boats are running in real time. If multiple boats are working the same area, there’s probably a reason.

    Step 5: Check marine weather and swell conditions. A perfect temperature break doesn’t help if you can’t get there safely or fish it effectively in heavy seas.

    SST charts won’t guarantee fish, but they dramatically improve your odds by putting you in the right water. The more you study them and correlate what you see on the chart with what happens on the water, the better you’ll get at reading the ocean.

    Plan Your Trip

    Start reading the water today:

    Related Guides

    Tight lines!

  • Best Water Temperature for Yellowtail Fishing

    Best Water Temperature for Yellowtail Fishing

    Yellowtail and Water Temperature

    California yellowtail (Seriola dorsalis) are one of the most temperature-sensitive gamefish on the West Coast. They’re warm-water fish with cold-water tolerance, which makes them uniquely responsive to the temperature patterns you can see on SST charts. Understanding their preferred temperature ranges — and how those preferences shift with the seasons — will put you on fish more consistently than any other single factor.

    Whether you’re fishing from a party boat out of San Diego or running a private boat to the islands, water temperature is the first thing to check before committing to a plan.

    The Magic Numbers

    Yellowtail along the Southern California and Baja coast generally bite best in a specific temperature window:

    Prime range: 62°F – 70°F

    This is where the majority of yellowtail action happens from San Diego to Cedros Island. Within this window, the fish are active, feeding aggressively, and willing to chase surface iron, yo-yo jigs, and live bait. Most captains will tell you that 64–68°F is the sweet spot.

    Fishable range: 58°F – 74°F

    Yellowtail can be caught outside the prime window. In winter, fish around the Coronado Islands and Colonet will bite in water as cool as 58°F, though they tend to be sluggish and deeper. In summer, fish at Guadalupe Island or the warmer Baja banks will feed in water up to 74°F, particularly in the morning before surface temps peak.

    Below 56°F: Yellowtail become lethargic and largely stop feeding. They’re still present but extremely difficult to catch on hook and line.

    Above 76°F: Yellowtail move deeper to find cooler water or migrate to areas with more moderate temperatures. Surface action shuts down.

    Quick Reference: Yellowtail Temperature Guide

    Condition Temp Range What to Expect
    Too Cold Below 56°F Fish lethargic, not feeding. Move south.
    Marginal 56°F – 61°F Slow bite. Deep presentations, yo-yo iron, dropper loop. Winter Baja pattern.
    Prime 62°F – 70°F Best action. Surface iron, live bait, fly-lined sardines. Fish are active and aggressive.
    Warm 70°F – 76°F Fish go deeper in midday. Best action at dawn and dusk. Common at Guadalupe.
    Too Warm Above 76°F Surface action stops. Fish deep or relocated. Target other species.

    Seasonal Patterns

    Spring (March – May): The Push North

    As water temperatures climb from winter lows, yellowtail begin pushing north from Baja into Southern California waters. The first fish of the season typically show up when coastal water around the Coronado Islands and Point Loma hits 60–62°F. Check the SoCal SST chart — when you see consistent 62°F+ readings along the coast, the spring yellowtail bite is about to fire.

    Spring fish often hold tight to the warm side of temperature breaks. A 60°F coastal zone with 64°F water sitting just offshore means yellowtail are staging along that edge, especially if there’s bait (sardines, anchovies) present. These fish are hungry after winter and respond well to live bait on a slider rig and yo-yo iron.

    For spring yellowtail, a quality conventional reel in the 30lb class with a smooth drag is essential — these fish make hard initial runs along structure, and a sticky drag means lost fish. Pair it with a 7-foot medium-heavy rod for the control you need around kelp and rocks.

    Summer (June – August): Peak Season

    Summer is prime time. Water temperatures along the SoCal coast typically range from 64–72°F, putting almost the entire inshore zone in the yellowtail’s wheelhouse. Fish spread out and can be found at the islands (Catalina, San Clemente, Coronados), the offshore banks (Tanner, Cortes), and all along the Baja coast down to Cedros. Check the San Diego fishing season calendar for a month-by-month breakdown.

    During summer, look for temperature breaks on the SST charts as concentrating features rather than range indicators — the fish are comfortable in most of the water, but they’ll stack up where breaks concentrate bait. A 2–3°F break near a kelp paddy or island point in 66°F water is a prime yellowtail setup.

    Summer is also the best time for surface iron fishing — aggressive yellowtail in warm water will chase a fast-moving iron across the surface without hesitation. Have a spinning setup ready with 30lb braid for long casts to boiling fish. See our jigs vs irons vs poppers guide to pick the right lure for the situation.

    Fall (September – November): Trophy Season

    Fall produces the biggest yellowtail of the year in SoCal waters. Water temps are at their annual peak (68–74°F) and the fish have been feeding all summer. This is when 30–40 pound fish show up at the islands and the kelp edges.

    On the SST chart, fall is when you’ll see the warmest water of the year. The key is watching for the first cooling events — when a cold-water intrusion or early-season upwelling drops a pocket of water a few degrees below the surrounding temps. Yellowtail feed aggressively ahead of the cooling, sensing the seasonal shift. These transitional days can produce the best fishing of the entire year.

    For trophy-class yellowtail in the fall, step up to a 30lb class reel with at least 20 pounds of drag and 300+ yards of 40lb braided line. A longer 8-foot rod gives you casting distance to reach breaking fish and the leverage to turn big yellows away from structure. Match it with a 30lb fluorocarbon leader — these fish are line-shy in clear fall water.

    Winter (December – February): Baja or Bust

    As SoCal water drops below 60°F, yellowtail fishing moves south. The 1.5-day and 2-day boats out of San Diego target yellowtail at Colonet, San Quintín, and the Benitos in 58–64°F water. These are colder conditions than summer, so the fish behave differently — they hold deeper, move slower, and prefer slower presentations like dropper loops and heavy jigs worked vertically.

    On the SST chart, look for the warmest pockets available within the Baja coastal zone. Even a 1-degree warm spot near a rocky point or reef can hold the only yellowtail in the area during winter. The fleet tracker is especially useful this time of year — if you see boats working a specific stretch of Baja coast, cross-reference their position with the SST chart to see what temperature they’re fishing.

    Winter yellowtail respond best to heavy yo-yo iron jigs dropped straight down and worked with a slow, methodical lift-and-drop. Use circle hooks on your live bait setups — in cold water, yellowtail tend to eat more slowly, and a circle hook converts those hesitant bites into solid hookups. If you’re planning a multi-day trip, check our overnight trip packing list so you don’t forget anything.

    Temperature vs. Other Factors

    Water temperature is critical but it’s not the only variable. Here’s how it interacts with other conditions:

    Bait availability trumps temperature. A pocket of 62°F water loaded with sardines will outfish a pristine 66°F zone with no bait every time. Use SST to narrow down where to look, then let the bait tell you exactly where to stop.

    Clarity matters. Yellowtail prefer clean, blue-green water. If upwelling brings cold, green, nutrient-rich water to the surface, the fish may avoid it even if the temperature is technically in range. Cross-reference SST with chlorophyll data — you want to fish the clean-water side of any plankton bloom. Our chlorophyll maps guide explains what to look for.

    Current creates opportunity. Moving water in the right temperature range is far more productive than slack water at the perfect temperature. A 1-knot current pushing 65°F water past a rocky point creates a feeding lane that yellowtail exploit all day long.

    Moon phase and tide. Yellowtail bite better on current, which is driven by tides. Spring tides (around new and full moons) produce the strongest current flow, which activates fish in water that’s already the right temperature.

    Swell and wind conditions. Don’t overlook the effect of swell and wind on the bite. Light wind and moderate swell push bait against structure, concentrating yellowtail along predictable edges. Check marine weather conditions before heading out.

    Using SST Charts to Find Yellowtail

    Here’s a practical approach for your next yellowtail trip:

    Step 1: Open the regional SST chart for your area. Identify zones in the 62–70°F range.

    Step 2: Within those zones, look for temperature breaks — edges where temperature changes by 2°F or more over a short distance.

    Step 3: Check the chlorophyll chart for the same area. Ideal setup is clean water on one side of the break and green water on the other.

    Step 4: Look at the fleet tracker. Are boats working near the break you’ve identified? Are they drifting slowly (likely fishing) or running (still looking)?

    Step 5: Factor in structure. If the break sits near a known yellowtail spot — a reef, island, seamount, or kelp edge — you’ve found your starting waypoint.

    The fish don’t read the charts, but they respond to the same conditions the charts reveal. Match the right temperature to the right structure and the right bait, and you’ve stacked the odds heavily in your favor.

    Recommended Gear for Yellowtail

    Having the right gear is just as important as finding the right water temperature. Here’s what we recommend for targeting yellowtail in SoCal and Baja:

    Water Temperature Guides for Other Species

    Every species has its own preferred temperature range. Check these guides to plan multi-species trips or know what to target when yellowtail aren’t cooperating:

    Frequently Asked Questions

    What is the best water temperature to catch yellowtail?

    The prime water temperature range for yellowtail is 62–70°F, with 64–68°F being the absolute sweet spot. Within this range, yellowtail are actively feeding and willing to chase surface iron, jigs, and live bait.

    Can you catch yellowtail in cold water?

    Yes, yellowtail can be caught in water as cool as 56–58°F, especially during winter around Baja. However, they’ll be deeper, slower, and require slow presentations like dropper loops and vertical jigs rather than surface lures.

    What is the best reel for yellowtail fishing?

    A two-speed conventional reel in the 30lb class with 20+ pounds of smooth drag is ideal for most SoCal yellowtail scenarios. Check our 30lb reel guide for specific picks at every budget.

    What line should I use for yellowtail?

    30–40lb braided line with a 25–30lb fluorocarbon leader is the standard yellowtail setup. Braid gives you sensitivity and casting distance; fluoro gives you abrasion resistance and invisibility around structure.

    When is yellowtail season in San Diego?

    Yellowtail can be caught year-round, but peak season in San Diego runs from May through November when water temperatures are consistently in the 62–72°F range. See the full San Diego fishing season calendar for month-by-month details.

    How do I read SST charts to find yellowtail?

    Open the regional SST chart, identify water in the 62–70°F range, then look for temperature breaks where temps change by 2°F+ over a short distance. Cross-reference with chlorophyll data and the fleet tracker to narrow down the best spots.


    Check today’s water temperatures on our regional SST charts and plan your next yellowtail trip around the data. Track where the fleet is fishing with the live fleet tracker, and read How to Read SST Charts if you’re new to satellite oceanography.

  • Finding Temperature Breaks

    Finding Temperature Breaks

    🌊 Find Temperature Breaks Today

    Check the current SST conditions on our free animated SST chart — updated daily with NOAA satellite data. Pair it with the chlorophyll map and AI enhanced regional charts to find where breaks are concentrating bait and fish.

    A temperature break is the single most important feature on an SST chart for offshore fishing. It’s where two water masses of different temperatures collide, creating a boundary that concentrates bait, builds structure in the open ocean, and draws in every predator from bluefin tuna to dorado. If you can read an SST chart well enough to find a defined temperature break, you’ve already eliminated 90% of the ocean from your search.

    This guide covers how to identify temperature breaks from satellite data, what makes a break productive, and how to build a pre-trip plan around the edges you find. For how to actually fish a break once you’re on the water, see our fishing the edges guide.

    What Is a Temperature Break?

    A temperature break is a sharp boundary where water temperature changes significantly over a short distance. On the SST chart, it shows up as a tight color transition — warm orange pressing against cool blue with a clean, defined line between them.

    Not all temperature changes are breaks. A gradual warming from 62°F to 66°F over 20 miles is just a gradient — bait and fish spread out and nothing concentrates. A jump from 62°F to 66°F over a quarter mile is a break — bait stacks along the boundary, predators patrol it, and everything you want to catch is in a narrow, fishable zone.

    The sharper the transition, the more productive the break. When you see a razor-sharp line on the SST chart, that’s where you want to be.

    How to Find Breaks on the SST Chart

    Step 1: Know Your Target Temperature

    Before you look at the chart, know what water your target species wants. This tells you which breaks matter:

    • Bluefin tuna: 60–72°F — look for breaks in this range, especially 62–68°F
    • Yellowfin tuna: 68–78°F — the warm side of offshore breaks
    • Dorado: 72–82°F — the warm, clean side where paddies collect
    • Yellowtail: 62–70°F — breaks near islands and structure
    • White seabass: 58–66°F — breaks near kelp during squid runs
    • Wahoo: 72–82°F — the warmest, cleanest side of any break

    Step 2: Scan for Sharp Transitions

    Open the SST chart and zoom to your fishing area. Look for places where the color changes abruptly — not gradually. A productive break typically shows a 2–4°F change over a short distance. The tighter the color bands, the sharper the break.

    Pay attention to where transitions intersect with underwater structure — banks, ridges, island drop-offs, and canyon edges. Structure plus a temperature break is a high-percentage combination.

    Step 3: Cross-Reference with Chlorophyll

    Switch to the chlorophyll map and check the same area. When a temperature break lines up with a chlorophyll edge — where green productive water meets clean blue water — you’ve found a “double edge.” These are the highest-probability fishing zones in the ocean because bait concentrates along both boundaries simultaneously. See our chlorophyll map guide for how to read these edges.

    Step 4: Watch the Animation

    Use the animated SST view to watch how the break has moved over the past week. A break that has been holding in the same area for 3–5 days is much more productive than one that just appeared. Persistent breaks give bait time to stack up and predators time to find it. A break that’s drifting rapidly may not have fish on it yet.

    Step 5: Confirm with the Fleet

    Check the fleet tracker to see if boats are already working the break. Multiple boats holding position along a line — rather than scattered randomly — is strong confirmation. If the satellite data and the fleet agree, you’ve found the bite.

    What Makes a Break Productive

    Not every temperature break holds fish. Here’s what separates a productive break from a dead one:

    Sharpness. A 3°F change over a quarter mile concentrates fish. The same change over 10 miles doesn’t. Look for the tightest color transitions on the chart.

    Persistence. A break that’s been in the same location for several days has had time to develop a food chain — plankton, bait, and predators. A brand-new break may take days to attract fish.

    Proximity to structure. Breaks near banks, seamounts, island drop-offs, and canyon edges are more productive than breaks in open, featureless water. Structure amplifies the edge effect by creating upwelling and additional current features.

    Bait presence. A sharp, persistent break near structure that also shows elevated chlorophyll (bait) is about as good as it gets. If you mark bait on your sounder when you arrive, you’re in the zone.

    Current alignment. Breaks that form along current boundaries — where water masses moving in different directions collide — concentrate bait more effectively than thermal breaks alone. These often show up as elongated features on the SST chart.

    Seasonal Break Patterns in SoCal

    Spring (March–May): Defined breaks form between cooler coastal upwelling and warmer offshore water as the season warms. These breaks push closer to shore through spring and are where early-season bluefin and yellowtail first show up. Check the SST chart weekly to track the warm water pushing in. Have your bluefin reel spooled with fresh 50–65lb braid before the season starts.

    Summer (June–August): Warm-water eddies spinning off the main current create circular temperature features with defined edges. These eddies can hold bluefin, yellowfin, and dorado for weeks. Look for circular warm features on the SST chart — the edges of these eddies are the fishing zones. Run a trolling spread along the edge while scanning for surface activity.

    Fall (September–November): The sharpest breaks of the year form close to the islands as the warmest water meets cooling coastal water. This is often when the biggest bluefin of the year are caught — trophy fish that have been feeding all summer stage along these tightening edges. Surface iron and poppers are at their most effective when fish are stacked on a defined fall break.

    Warm-water intrusions (any season): Tongues of warm water pushing inshore create narrow corridors with defined edges on both sides. Dorado and yellowfin ride these intrusions inshore, and the edges are where kelp paddies and debris collect. Run your dorado trolling spreadcedar plugs and feathers — along the warm side while searching for paddies.

    Plan Your Trip

    Find today’s temperature breaks before you leave the dock:

    Related Guides

    Tight lines!