• Fishing The Edges

    Fishing The Edges

    You’ve checked the SST chart, found a sharp temperature break, cross-referenced the chlorophyll map, and run offshore to the coordinates. Now you’re sitting on the edge. What do you actually do?

    Edges — temperature breaks, chlorophyll boundaries, color changes, current seams — are the most productive features in the open ocean. But finding one and fishing one effectively are two different skills. This guide covers how to work an edge once you’re on it: trolling strategy, which side to fish for each species, when to switch from trolling to casting, and how to keep the bite going.

    Why Edges Hold Fish

    Fish don’t spread evenly across the ocean. They concentrate along boundaries for two reasons: food and comfort.

    Baitfish use edges as reference points. In open water with no structure, bait schools have nothing to orient to and spread out. When they encounter a temperature change, a current boundary, or a color break, they travel along it rather than cross it. This funnels scattered bait into defined corridors that predators learn to patrol.

    Gamefish have thermal preferences — a bluefin might prefer 66°F water but will hunt in 63°F water if that’s where the bait is. The edge lets them stage in comfortable temps while making quick forays into adjacent water to feed. You’ll often find fish holding just on the warm side of a break, facing into the cooler water where bait is getting pushed toward them.

    Types of Edges

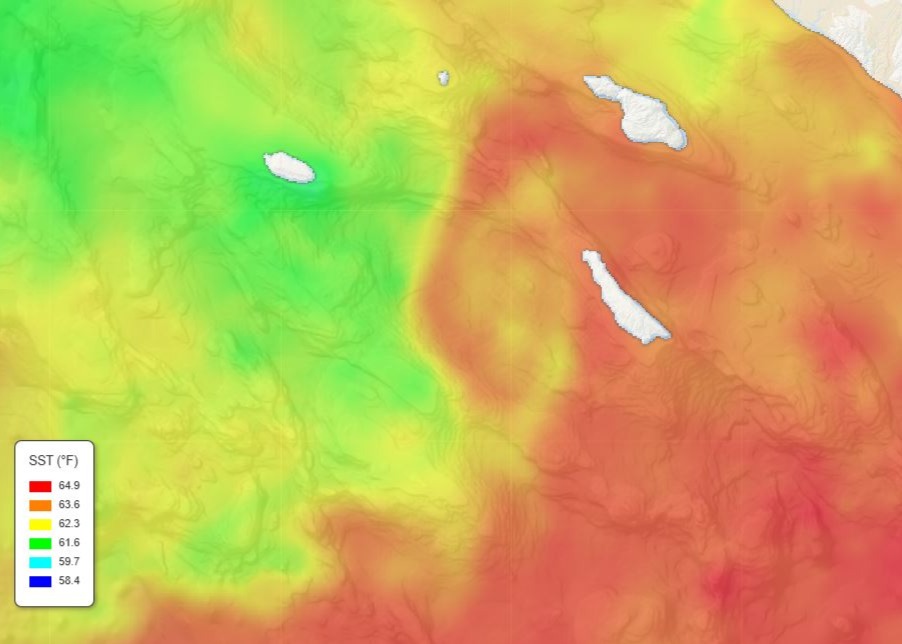
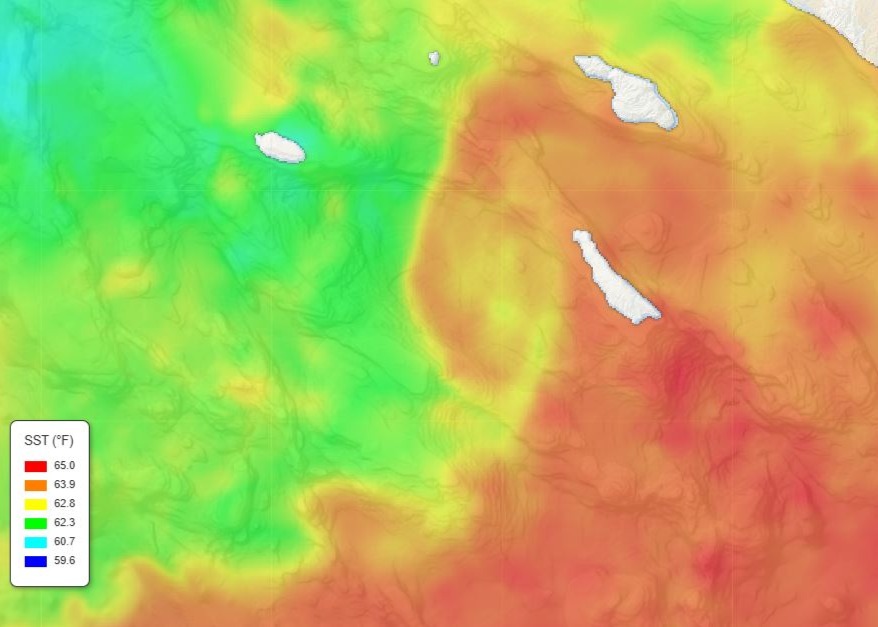
    Temperature breaks. Where water masses of different temperatures meet. The sharper the transition, the more fish concentrate. A 3°F change over a quarter mile is far more productive than the same change over five miles. See our finding temperature breaks guide for how to identify these on the SST chart before your trip.

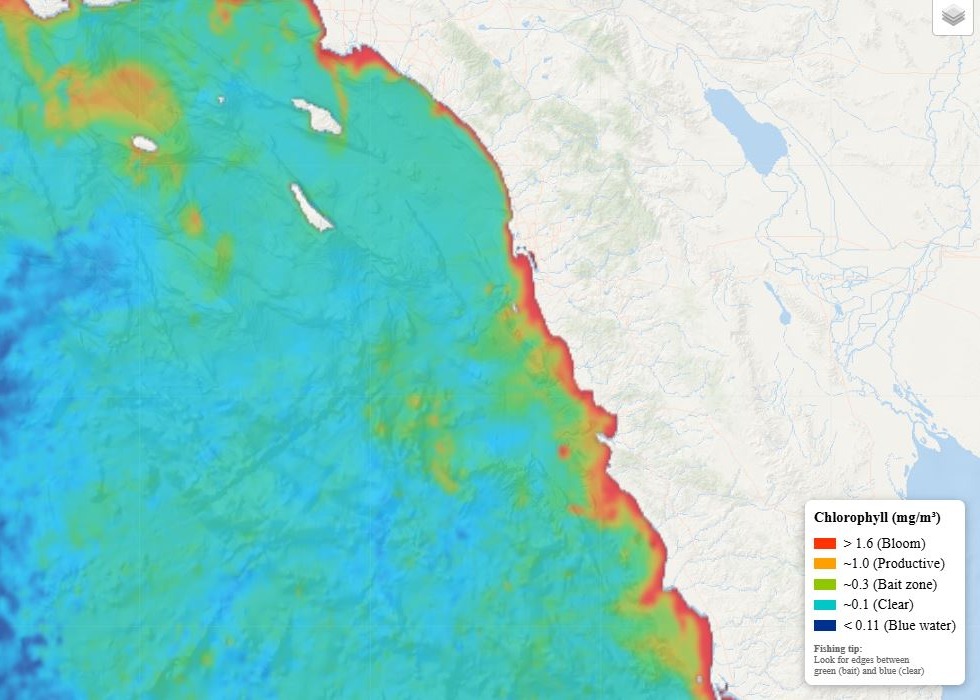
    Chlorophyll edges. Where productive green water meets clean blue water. Bait stays near their food source on the green side; predators prefer the visibility of the blue side. The edge gives both what they want, creating a natural ambush zone. See our chlorophyll map guide for reading these from satellite data.

    Color changes. Visible from the boat as a distinct line where green meets blue. This often indicates different water masses meeting and typically corresponds to temperature or chlorophyll boundaries. When you see one on the water, you’re on the edge — start fishing.

    Current seams. Where currents of different speeds or directions meet. Debris, kelp paddies, and bait accumulate along the seam. These sometimes show up on SST imagery as elongated temperature features, but they’re often easier to spot on the water — look for lines of foam, debris, or color change.

    Structure edges. Where the seafloor rises from deep water to a bank, ridge, or seamount. Upwelling along these features creates productive water above. When a temperature break or chlorophyll edge lines up with a structure edge, you’ve found a high-probability zone.

    Which Side Does Each Species Want?

    Knowing which side of the edge your target species prefers tells you where to concentrate your trolling passes and casting efforts.

    Bluefin tuna — Hold on the cooler side in 60–68°F water, darting into warmer or greener water to feed. When you find bluefin on a break, surface iron (Tady 45) and poppers thrown into the boil are the play. For trolling the edge, run cedar plugs and feathers along the cooler side. Have your 40lb+ setup rigged with 50–65lb braid. When fish are on the meter but won’t eat lures, drop a fly-line rig with a circle hook.

    Yellowfin tuna — Prefer the warm side of the edge in 72°F+ water. Less line-shy than bluefin, so brighter trolling lures and faster retrieves work. When mixed with bluefin on the same edge, yellowfin tend to hold slightly warmer and higher in the column.

    Dorado — Warm, clean side in 72°F+ water. Dorado concentrate where the edge collects floating debris and kelp paddies. The edge itself pushes floating structure into pockets and bends, and dorado follow it. Run a dorado trolling spread along the blue side while scanning for paddies — when you find one, switch to casting iron and poppers. A 20lb spinning setup handles dorado perfectly.

    Yellowtail — Less picky about which side. They’ll feed comfortably in greener, more productive water around kelp and structure. Temperature breaks near islands and reefs are yellowtail magnets. Bring your iron and jigs — the Tady 45 for surface boils, flat-falls when they’re deep on structure. A 30lb class setup with 40lb braid covers it.

    White seabass — Productive (green) side of the edge in 59–65°F water, especially where squid are spawning near kelp beds. Fish the kelp edges at dawn with a slider rig and live squid on a 4/0–6/0 circle hook. See our hooks guide for specifics.

    Wahoo — The warmest, cleanest side, 76–82°F. They’re speed hunters that patrol defined boundaries. High-speed trolling (8–14 knots) along the warm side with wire leader is the standard approach.

    How to Work the Edge

    Troll Parallel First

    Run your initial trolling passes along the edge, not across it. This keeps your spread in the productive zone for the entire pass. If you troll perpendicular to the break, your lures spend most of their time in open, unproductive water on either side. Parallel passes also help you map how far the edge extends and where it bends — irregularities are often the hottest spots.

    Note Which Side Produces

    After a few passes, the fish will tell you where they want to be. Mark the GPS coordinates of every strike and look for the pattern — are they consistently on the warm side? The cool side? Right on the line? Adjust your passes to keep the spread in the strike zone.

    Work the Bends and Points

    Edges rarely run perfectly straight. Where the boundary juts out, curves sharply, or creates a pocket, bait tends to collect. These irregularities are the first places to fish and the last places to leave. On the SST chart, these show up as fingers or bumps in the temperature contour line.

    Switch from Trolling to Casting

    When fish show on the surface — boils, birds working, bait getting pushed up — it’s time to stop trolling and start casting. Kill the engines upwind of the activity and drift through. Have your iron rod rigged and ready: Tady 45 with Owner ST-66 trebles for tuna and yellowtail, or a popper when fish are blowing up on top. The first lure in the water gets bit — speed matters more than lure selection in the first 30 seconds of a stop.

    Don’t Abandon It Too Quickly

    An edge that looks dead might just be between feeding windows. If the satellite data shows a strong feature and the fleet tracker has boats nearby, give it time. Pelagics feed in bursts — being in the right place when they switch on matters more than constantly moving to find a new edge.

    Chum the Edge

    If you’re stopped on a meter mark or a recent boil, toss handfuls of live bait over the side while casting. The combination of flylined baits and artificial lures swimming through a chum line is hard for any fish to resist. Have multiple rods rigged — some with circle hooks for bait, some with iron for casting.

    Double Edges: The Highest-Probability Zones

    When a temperature break lines up with a chlorophyll edge — warm water meeting cool water at the same place where green productive water meets clean blue water — you’ve found a “double edge.” These are the best features in the ocean for fishing because bait concentrates along both boundaries simultaneously.

    Triple edges add bottom structure to the equation. A temperature break that sits over a bank or ridge with a chlorophyll edge in the same area is about as good as offshore fishing gets. Every predator in the area will be working that zone.

    Use the SST chart and chlorophyll map together to identify these overlapping features before your trip. See our finding temperature breaks and chlorophyll map guides for the step-by-step workflow.

    Plan Your Trip

    Find today’s edges before you leave the dock:

    Related Guides

    Tight lines!

  • Understanding Upwelling

    Understanding Upwelling

    How Cold Water from Below Creates Hot Fishing Above

    Along the coasts of Baja and Southern California, some of the most productive fishing water doesn’t flow in from somewhere else — it rises up from below. This process, called upwelling, is responsible for the rich marine ecosystem that makes our region one of the best fisheries on the Pacific coast. Understanding how it works helps you predict where the bite will be — and what gear to have ready when you get there.

    The Mechanics of Upwelling

    Upwelling starts with wind. When prevailing winds blow parallel to the coastline, a phenomenon called Ekman transport pushes surface water offshore at an angle. As that surface water moves away from shore, cold water from depth rises to replace it.

    This deep water is fundamentally different from what was at the surface. It’s colder, often by 10 degrees or more, and it’s loaded with nutrients — nitrates, phosphates, and silicates that have accumulated in the deep from decomposing organic matter. When this nutrient-rich water hits the sunlit surface, it fertilizes an explosion of phytoplankton growth.

    That phytoplankton bloom feeds the entire food chain above it. Zooplankton multiply, baitfish arrive to graze, and gamefish follow the bait. A strong upwelling event can transform a biological desert into productive fishing grounds within a week.

    Where Upwelling Happens

    Upwelling isn’t uniform along the coast. It concentrates around specific geographic features.

    Headlands and points. Where the coastline juts out into prevailing winds, upwelling intensifies. Points like Punta Banda, Punta Colonet, and Cabo San Lucas are reliable upwelling hotspots. The cold, green water often extends offshore from these landmarks in visible plumes.

    Submarine canyons. Deep water close to shore makes it easier for upwelled water to reach the surface. Canyons act as conduits, channeling cold water upward along their walls. The edges of these canyons, where upwelled water meets ambient surface water, create distinct temperature breaks.

    Islands and banks. Offshore features can generate localized upwelling when currents flow past them. The downstream side of islands often shows cooler, more productive water. Seamounts and underwater ridges create similar effects — the same structure that generates upwelling also holds yellowtail and white seabass along the edges.

    Reading Upwelling on the Charts

    On the SST chart, active upwelling appears as tongues of cold water extending from the coast or from bathymetric features. The color will be notably cooler than surrounding offshore water — often blue or purple against green or yellow backgrounds.

    The key features to look for:

    Sharp thermal gradients at the upwelling edge. Where the cold upwelled water meets warmer surface water, you get a distinct temperature break. This edge is prime fishing territory — bait concentrates there, and predators patrol it. See our fishing the edges guide for how to work these boundaries once you’re on the water.

    Corresponding chlorophyll blooms. Flip to the chlorophyll map and look for elevated readings in the same area. Fresh upwelling might show cold water but low chlorophyll (the nutrients haven’t spurred a bloom yet). Mature upwelling shows both cold temps and high chlorophyll. Aging upwelling may show the chlorophyll persisting even as water temperatures moderate. See our chlorophyll map guide for how to read these patterns.

    Plume direction. Upwelled water gets pushed offshore and curves with the currents. Tracking where that plume extends helps you find productive edges further from the coast where fishing pressure is lighter.

    Timing the Upwelling Cycle

    Upwelling events follow a cycle that directly impacts fishing quality.

    Days 1–2: Fresh upwelling. Water temps drop sharply, but chlorophyll hasn’t responded yet. Bait may scatter as conditions change rapidly. Fishing can be tough — you have cold, clear water without an established food chain.

    Days 3–5: Building productivity. Phytoplankton respond to the nutrients. Chlorophyll levels climb. Zooplankton populations grow. Bait begins concentrating along the upwelling edges. Fishing improves.

    Days 5–10: Peak conditions. The full food chain is operating. Bait is stacked on the edges, gamefish are actively feeding. Temperature breaks are well-defined. This is the window you want to hit.

    Days 10+: Relaxation. Winds shift, upwelling weakens, surface water warms. The bloom may persist, but the sharp edges soften. Fishing remains decent but becomes less predictable.

    Watching the multi-day trend on the SST chart animation helps you catch the upwelling cycle at its peak rather than arriving too early or too late.

    Which Species Benefit from Upwelling

    Different species relate to upwelling differently. Knowing where each one sits in the upwelling picture tells you what to target — and what gear to bring:

    Yellowtail push up the coast following bait that concentrates along upwelling edges, especially in spring. They feed comfortably in the greener, productive water and don’t avoid it like tuna do. Upwelling zones near islands and reefs are yellowtail magnets. Bring your iron and jigs — the Tady 45 for surface boils, flat-falls for fish on deep structure. A 30lb class setup covers it.

    White seabass thrive in upwelling conditions. The cold, nutrient-rich water triggers squid spawning runs, and white seabass follow the squid into the kelp. When you see mature upwelling (cold water + high chlorophyll) near kelp beds in 58–65°F water during spring, that’s white seabass territory. Fish the kelp edges at dawn with a slider rig and live squid on a 4/0–6/0 circle hook.

    Bluefin tuna work the outer edges of upwelling plumes — where the cold productive water meets warmer offshore water. They stage in the cleaner water and dart into the green side to feed. Look for upwelling edges where temperature hits the 62–68°F sweet spot. Have your tuna setup rigged with 50–65lb braid and iron ready.

    Halibut respond to nearshore upwelling that pushes bait onto sandy flats. When the SST chart shows upwelling bringing water into the upper 50s to low 60s along the coast, halibut move shallow to feed. Swimbaits and Carolina rigs on the sandy flats produce best during these events.

    Dorado and yellowfin prefer the warm, clean side — they avoid the upwelling core but feed along its outer boundary where kelp paddies and debris collect along the current edge. Run a trolling spreadcedar plugs and feathers — along the warm side of the upwelling edge.

    Seasonal Patterns

    Spring (March–May) is the classic upwelling season along the Baja and SoCal coast. Northwest winds strengthen, and regular upwelling events create the productivity that fuels summer fishing. This is when yellowtail push up the coast following the bait, white seabass move into the kelp for squid, and early-season bluefin show up along the outer edges.

    Summer (June–August) sees reduced but localized upwelling. Look for persistent cold spots around known features — these become magnets for bait and fish when surrounding water gets warm and sterile. The contrast between upwelling zones and the warm offshore water creates some of the sharpest temperature breaks of the year.

    Fall (September–November) brings variable conditions. Wind patterns shift, and upwelling becomes less predictable. But fall upwelling events, when they happen, can produce excellent fishing as fish feed heavily before water cools.

    Winter (December–February) generally has the weakest upwelling, but some localized events occur during Santa Ana wind patterns when offshore flow reverses the typical direction. Check the SST chart during and after Santa Ana events — the wind-driven mixing can create unexpected productive zones.

    Practical Application

    Before planning a trip, review several days of SST charts to identify active upwelling zones. Look for cold-water plumes extending from known headlands or structure. Check if those same areas show elevated chlorophyll on the chlorophyll map — that tells you the upwelling has matured enough to build a food chain.

    Target the edges of the upwelling plume rather than the coldest water at its core. The core might be too cold for your target species, while the edges offer the combination of nutrients, bait, and comfortable temperatures that stack fish. See our fishing the edges guide for how to work these boundaries effectively.

    Upwelling is the engine that drives productivity in our coastal waters. Learn to read it on the charts, and you’ll understand why certain spots fire while others stay quiet — and you’ll know where to be when conditions come together.

    Plan Your Trip

    Read the upwelling before you leave the dock:

    Related Guides

    Tight lines!

  • How to Read SST Charts for Fishing

    How to Read SST Charts for Fishing

    🌊 View Today’s SST Chart

    Check today’s water temperatures on our free animated SST chart — updated daily with NOAA satellite data. Pair it with the chlorophyll map and AI enhanced regional charts to find where fish are holding.

    Why SST Charts Matter for Fishing

    Sea surface temperature (SST) charts are one of the most powerful tools in a saltwater angler’s toolkit. They show you where warm and cold water masses meet, where currents are flowing, and ultimately where the fish are likely holding. Learning to read them takes your fishing from guesswork to strategy.

    Whether you’re running offshore out of San Diego chasing bluefin or trolling the Baja coast for yellowtail, understanding what you’re looking at on an SST chart can mean the difference between a wide-open bite and a long boat ride home.

    Understanding the Color Scale

    Every SST chart uses a color gradient to represent water temperature. Typically, cooler water appears in blues and greens while warmer water shows up in yellows, oranges, and reds. The exact temperature each color represents is shown in the chart’s legend — always check it, because the scale changes depending on the region and time of year.

    For Southern California waters in winter, you might see a scale ranging from 56°F to 64°F. In summer, that same region could show 62°F to 74°F. A chart of the Sea of Cortez in August might run from 80°F to 90°F. Context matters.

    What to Look For First

    Don’t get overwhelmed by the full chart. Start with these three things:

    1. Color contrast. Areas where colors change sharply — where deep blue sits right next to bright green, for example — indicate rapid temperature changes over a short distance. These are temperature breaks, and they’re where you want to fish. See our fishing the edges guide for how to work them once you’re on the water.

    2. Warm-water intrusions. Look for tongues or fingers of warmer water pushing into cooler areas. These often indicate current flow bringing warm offshore water closer to the coast, and gamefish follow them inshore. Dorado and yellowfin ride these intrusions, and the edges are where kelp paddies and debris collect.

    3. Eddies. Circular patterns in the temperature data indicate eddies — rotating pockets of water that concentrate bait and plankton along their edges. Warm-core eddies spinning clockwise (in the Northern Hemisphere) are particularly productive for tuna and billfish. The edges of these eddies are where you want to troll and cast iron.

    Satellite Data: What You’re Actually Seeing

    SST charts are built from satellite-mounted infrared sensors that measure the thermal radiation coming off the ocean’s surface. The data represents roughly the top millimeter of water. A few important caveats:

    Cloud cover creates gaps. Infrared sensors can’t see through clouds. If you notice blank spots or oddly smooth areas on a chart, that’s likely cloud contamination. Multi-day composite charts (like our 14-day SST animation) help fill these gaps by layering multiple days of data.

    Surface vs. depth. What the satellite sees is skin temperature. The water 10 or 20 feet down can be significantly different, especially in areas with strong thermoclines. SST charts tell you where to start looking — your fishfinder and temperature gauge tell you the rest of the story. When bluefin are sitting below the thermocline, flat-fall jigs and deep-set baits get down to where the fish are actually holding.

    Morning vs. afternoon. Solar heating can warm the surface by 1–2°F during calm, sunny days. Most satellites pass in the early morning or late evening to minimize this effect, but it’s worth knowing.

    What Temperature Does Each Species Want?

    Once you can read the chart, you need to know what temperature range to look for. Every species has a preferred window — here’s the quick reference for SoCal targets:

    SpeciesPreferred Temp (°F)Sweet SpotGear Guide
    Bluefin Tuna60–72°F62–68°FJigs · Lures · Reels
    Yellowfin Tuna68–78°F72–78°FLures · Poppers
    Dorado72–82°F74–78°FLures · Reels
    Yellowtail62–70°F64–68°FJigs · Reels
    White Seabass58–66°F60–64°FSlider Rig · Hooks
    Halibut56–68°F59–65°FSwimbaits · Carolina Rig
    Wahoo72–82°F76–80°F40lb Reels

    Find the temperature range for your target on the SST chart, then look for breaks within that range. That’s where the fish are concentrated.

    Reading SST Charts by Region

    Southern California

    The SoCal Bight is defined by the interaction between the cold, south-flowing California Current and warmer water pushing up from Baja. In spring and summer, look for warm-water intrusions pushing north past San Clemente Island and into the offshore banks. Bluefin tuna often stage along the leading edge of these warm pushes in 64–68°F water. Have your tuna setup rigged with 50–65lb braid and iron ready before you reach the break.

    Baja Pacific Coast

    The Baja coast features dramatic upwelling zones where cold, nutrient-rich water rises to the surface near headlands and points. Look for tight color gradients near Punta Colonet, San Quintín, and Cedros Island. Yellowtail and white seabass stack up along these upwelling boundaries. The chlorophyll map is especially useful here — upwelling creates bright green productive zones that concentrate bait along defined edges.

    Cabo & Sea of Cortez

    Warm-water species like dorado, wahoo, and marlin key on the warmest water. During summer and fall, look for blue water (80°F+) pushing close to the cape. In the Cortez, temperature breaks can form mid-channel between the Baja peninsula and the mainland — these are highway on-ramps for striped marlin. Run a trolling spreadcedar plugs and feathers — along these mid-channel breaks.

    Putting It Into Practice

    Here’s a simple workflow for planning your next trip using SST data:

    Step 1: Check the regional SST chart for your fishing area. Note any obvious temperature breaks or warm-water intrusions.

    Step 2: Compare today’s chart to the past few days using the 14-day animation. Is warm water pushing in or pulling back? Stable conditions fish better than rapidly changing ones.

    Step 3: Cross-reference with chlorophyll data. High chlorophyll (green water) adjacent to clean blue water is a bait magnet. Where bait stacks up, gamefish follow. See our chlorophyll map guide for the full breakdown.

    Step 4: Factor in the boat reports. Check what the fleet is finding — our fleet tracker shows you where the boats are running in real time. If multiple boats are working the same area, there’s probably a reason.

    Step 5: Check marine weather and swell conditions. A perfect temperature break doesn’t help if you can’t get there safely or fish it effectively in heavy seas.

    SST charts won’t guarantee fish, but they dramatically improve your odds by putting you in the right water. The more you study them and correlate what you see on the chart with what happens on the water, the better you’ll get at reading the ocean.

    Plan Your Trip

    Start reading the water today:

    Related Guides

    Tight lines!