🌊 View Today’s SST Chart
Check today’s water temperatures on our free animated SST chart — updated daily with NOAA satellite data. Pair it with the chlorophyll map and AI enhanced regional charts to find where fish are holding.
Why SST Charts Matter for Fishing
Sea surface temperature (SST) charts are one of the most powerful tools in a saltwater angler’s toolkit. They show you where warm and cold water masses meet, where currents are flowing, and ultimately where the fish are likely holding. Learning to read them takes your fishing from guesswork to strategy.
Whether you’re running offshore out of San Diego chasing bluefin or trolling the Baja coast for yellowtail, understanding what you’re looking at on an SST chart can mean the difference between a wide-open bite and a long boat ride home.
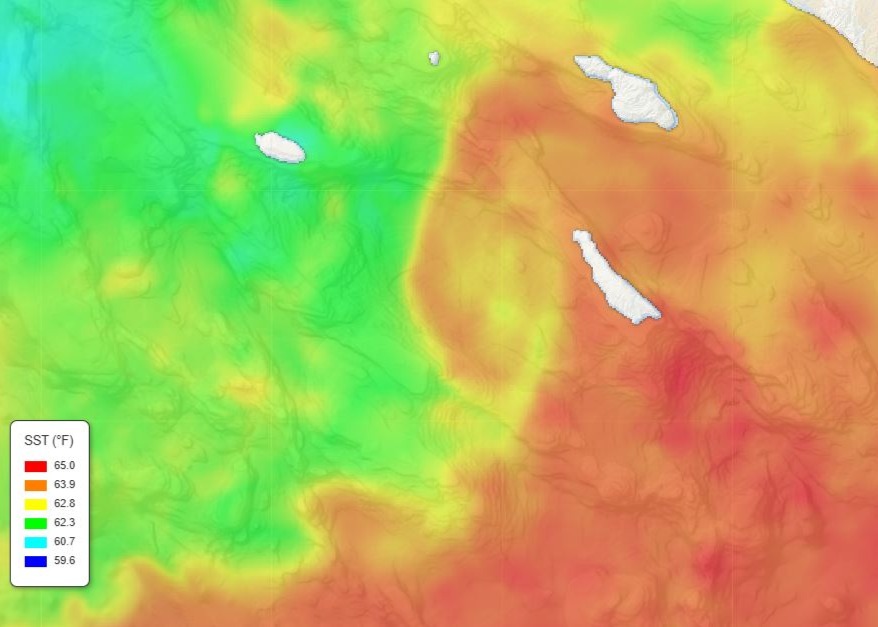
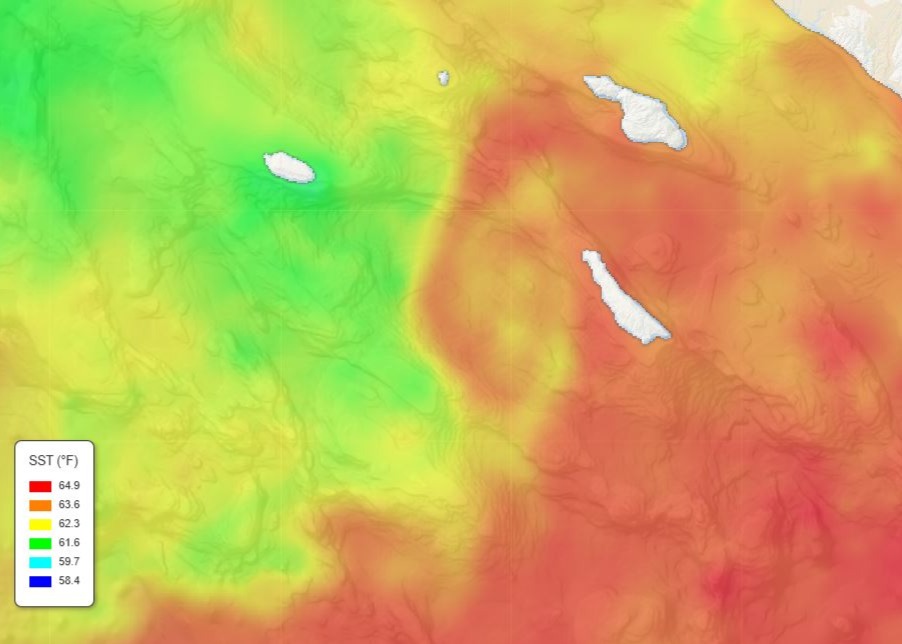
Understanding the Color Scale
Every SST chart uses a color gradient to represent water temperature. Typically, cooler water appears in blues and greens while warmer water shows up in yellows, oranges, and reds. The exact temperature each color represents is shown in the chart’s legend — always check it, because the scale changes depending on the region and time of year.
For Southern California waters in winter, you might see a scale ranging from 56°F to 64°F. In summer, that same region could show 62°F to 74°F. A chart of the Sea of Cortez in August might run from 80°F to 90°F. Context matters.
What to Look For First
Don’t get overwhelmed by the full chart. Start with these three things:
1. Color contrast. Areas where colors change sharply — where deep blue sits right next to bright green, for example — indicate rapid temperature changes over a short distance. These are temperature breaks, and they’re where you want to fish. See our fishing the edges guide for how to work them once you’re on the water.
2. Warm-water intrusions. Look for tongues or fingers of warmer water pushing into cooler areas. These often indicate current flow bringing warm offshore water closer to the coast, and gamefish follow them inshore. Dorado and yellowfin ride these intrusions, and the edges are where kelp paddies and debris collect.
3. Eddies. Circular patterns in the temperature data indicate eddies — rotating pockets of water that concentrate bait and plankton along their edges. Warm-core eddies spinning clockwise (in the Northern Hemisphere) are particularly productive for tuna and billfish. The edges of these eddies are where you want to troll and cast iron.
Satellite Data: What You’re Actually Seeing
SST charts are built from satellite-mounted infrared sensors that measure the thermal radiation coming off the ocean’s surface. The data represents roughly the top millimeter of water. A few important caveats:
Cloud cover creates gaps. Infrared sensors can’t see through clouds. If you notice blank spots or oddly smooth areas on a chart, that’s likely cloud contamination. Multi-day composite charts (like our 14-day SST animation) help fill these gaps by layering multiple days of data.
Surface vs. depth. What the satellite sees is skin temperature. The water 10 or 20 feet down can be significantly different, especially in areas with strong thermoclines. SST charts tell you where to start looking — your fishfinder and temperature gauge tell you the rest of the story. When bluefin are sitting below the thermocline, flat-fall jigs and deep-set baits get down to where the fish are actually holding.
Morning vs. afternoon. Solar heating can warm the surface by 1–2°F during calm, sunny days. Most satellites pass in the early morning or late evening to minimize this effect, but it’s worth knowing.
What Temperature Does Each Species Want?
Once you can read the chart, you need to know what temperature range to look for. Every species has a preferred window — here’s the quick reference for SoCal targets:
| Species | Preferred Temp (°F) | Sweet Spot | Gear Guide |
|---|---|---|---|
| Bluefin Tuna | 60–72°F | 62–68°F | Jigs · Lures · Reels |
| Yellowfin Tuna | 68–78°F | 72–78°F | Lures · Poppers |
| Dorado | 72–82°F | 74–78°F | Lures · Reels |
| Yellowtail | 62–70°F | 64–68°F | Jigs · Reels |
| White Seabass | 58–66°F | 60–64°F | Slider Rig · Hooks |
| Halibut | 56–68°F | 59–65°F | Swimbaits · Carolina Rig |
| Wahoo | 72–82°F | 76–80°F | 40lb Reels |
Find the temperature range for your target on the SST chart, then look for breaks within that range. That’s where the fish are concentrated.
Reading SST Charts by Region
Southern California
The SoCal Bight is defined by the interaction between the cold, south-flowing California Current and warmer water pushing up from Baja. In spring and summer, look for warm-water intrusions pushing north past San Clemente Island and into the offshore banks. Bluefin tuna often stage along the leading edge of these warm pushes in 64–68°F water. Have your tuna setup rigged with 50–65lb braid and iron ready before you reach the break.
Baja Pacific Coast
The Baja coast features dramatic upwelling zones where cold, nutrient-rich water rises to the surface near headlands and points. Look for tight color gradients near Punta Colonet, San Quintín, and Cedros Island. Yellowtail and white seabass stack up along these upwelling boundaries. The chlorophyll map is especially useful here — upwelling creates bright green productive zones that concentrate bait along defined edges.
Cabo & Sea of Cortez
Warm-water species like dorado, wahoo, and marlin key on the warmest water. During summer and fall, look for blue water (80°F+) pushing close to the cape. In the Cortez, temperature breaks can form mid-channel between the Baja peninsula and the mainland — these are highway on-ramps for striped marlin. Run a trolling spread — cedar plugs and feathers — along these mid-channel breaks.
Putting It Into Practice
Here’s a simple workflow for planning your next trip using SST data:
Step 1: Check the regional SST chart for your fishing area. Note any obvious temperature breaks or warm-water intrusions.
Step 2: Compare today’s chart to the past few days using the 14-day animation. Is warm water pushing in or pulling back? Stable conditions fish better than rapidly changing ones.
Step 3: Cross-reference with chlorophyll data. High chlorophyll (green water) adjacent to clean blue water is a bait magnet. Where bait stacks up, gamefish follow. See our chlorophyll map guide for the full breakdown.
Step 4: Factor in the boat reports. Check what the fleet is finding — our fleet tracker shows you where the boats are running in real time. If multiple boats are working the same area, there’s probably a reason.
Step 5: Check marine weather and swell conditions. A perfect temperature break doesn’t help if you can’t get there safely or fish it effectively in heavy seas.
SST charts won’t guarantee fish, but they dramatically improve your odds by putting you in the right water. The more you study them and correlate what you see on the chart with what happens on the water, the better you’ll get at reading the ocean.
Plan Your Trip
Start reading the water today:
- SST Chart — Daily satellite water temperature data for SoCal and Baja
- Chlorophyll Map — Find where bait is concentrating
- AI Enhanced Regional Charts — High-resolution composites by region
- Marine Weather — Wind, swell, and offshore conditions
- Fleet Tracker — See where boats are fishing right now
- AI Fishing Predictions — Data-driven forecasts combining SST, chlorophyll, and historical data
- SD Fishing Season Calendar — What’s biting this month
Related Guides
- Finding Temperature Breaks
- Fishing the Edges
- How to Use Chlorophyll Maps
- How to Fish Kelp Paddies
- Swell, Wind & Fishing Conditions
- Best Water Temp for Bluefin Tuna
- Best Water Temp for Yellowfin Tuna
- Best Water Temp for Dorado
- Best Water Temp for Yellowtail
- Best Water Temp for White Seabass
- Best Water Temp for Halibut
- Best Water Temp for Wahoo
- Best Lures for Tuna
- Best Tuna Jigs
- Best Lures for Dorado
- Best Yellowtail Jigs & Irons
- Best Poppers for Tuna
- Surface Iron Fishing Guide
- Best Swimbaits for Halibut
- Best Reel for Bluefin Tuna
- Best Reel for Yellowtail
- Best 20lb Reels
- Best 40lb Reels
- Best Rod & Reel Combos for SoCal
- Best Hooks by Species
- Braid vs Mono vs Fluorocarbon
- Best Fishing Line by Pound Test
- Best Fishing Knots
- Carolina Rig Setup
- Slider Rig for Live Bait
- Overnight Trip Packing List
- SD Fishing Season Calendar
Tight lines!